In my previous post I forgot to link to the Python code for the piggie model.
Since I’m posting a correction, I measured our pig pen as 16m x 20m. So I ran the model 100 times for this rectangle.
data = read_csv("data/2023-06-01.csv")100 sims is too many to do all at once, so I’ve done the middle quartiles of each step.
data %>%
  group_by(Step) %>%
  summarise(  n = list(quantile(n))) %>%
  mutate( group = list(c("0%", "25%", "50%", "75%", "100%"))) %>%
  unnest() %>%
  ungroup() %>%
  filter(group != "0%") %>%
  filter(group != "100%") %>%
  ggplot(aes(x=Step, y=n, colour=group)) +
    geom_line() +
    ggthemes::scale_colour_few()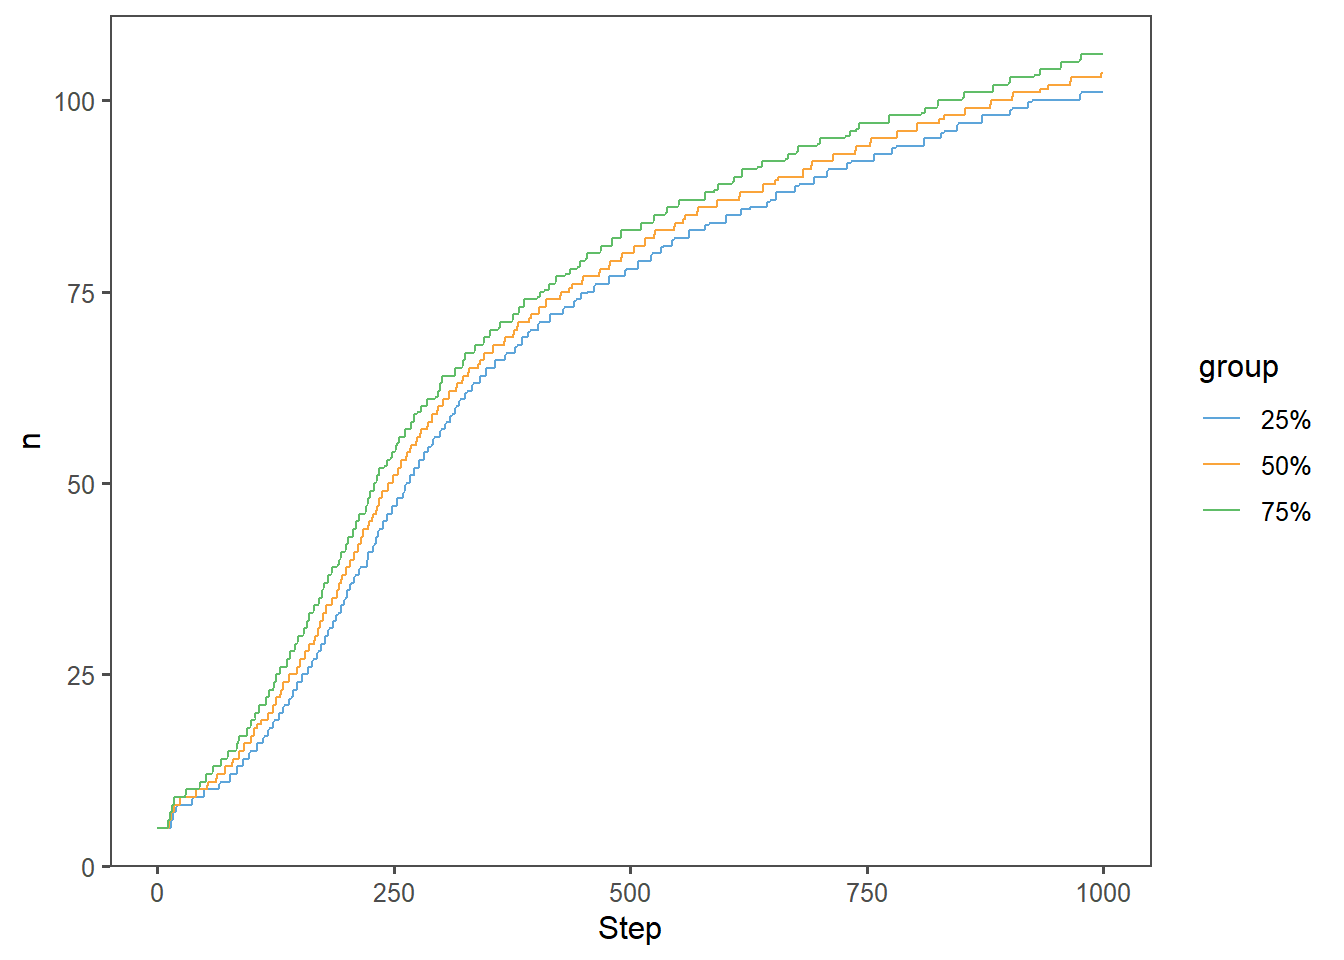
We get something approximating exponential growth until about 50 piggies in 250 ticks, followed by another 50 piggies in 750 ticks.
250 ticks in this setup is 2500 minutes, or about 42 hours. I’ll see if I can persuade the other players on our server to only feed the piggies until we have about 50.