Valheim is a survival base-builder and exploration and … it’s viking minecraft for adults.
My group has a pig farm. The constraints on the pigs looks well-suited to agent-based modelling. Well, the game runs an agent-based model, I’m trying to take some of the properties out of the game to optimise some stuff.
I’m iterating a model in Python with the mesa agent-based modelling library. So far it lets me estimate the relationship between pen size, and maximum population from overcrowding.
This isn’t a fixed maximum. No matter how large the population you can always potentially have all but 2 piggies sitting in one corner of the pen, with two piggies in the opposite corner feeling uncrowded.
model limitations
Properties for the model taken from Valheim Wiki.
The model has piggies sitting exactly on a cartesian grid of 1m x 1m squares, the game seems more granular. This mostly affects the distance calcs.
The model at this stage assumes the piggies are always well-fed. Adding food is for the next iteration.
The model has a tick of 10 minutes. If the piggies are within range for 10 minutes then they should just ignore probability of mating and love points, they’ll almost certainly hit 3 love points within 10 mins.
I mostly modified mesa examples until I had something that worked, and worked the way I wanted it to. In particular I really like the included server to visualise what’s going on. It’s like having NETLOGO visualisation when you need it, and dropping it to save computer time when you don’t.
For example, the visualisation showed me that randomly scattering piggies across the pen slowed down initial breeding because they might not be able to see any potential mate. In this iteration all piggies start in the same space.
Did I tick the model enough for a stable final population
data = read_csv("data.csv") If I average out the outputs over a given pen width, towards the end of the model run, most of the populations are stable. Ish. The bigger pen sizes aren’t quite stable yet.
data %>%
  filter(Step > 950) %>%
  group_by(width, Step) %>%
  summarise(n=mean(n)) %>%
  ungroup() %>%
  mutate(width = as_factor(width)) %>%
  ggplot(aes(x=Step, y=n, colour=width)) +
    geom_line() +
    scale_colour_viridis_d()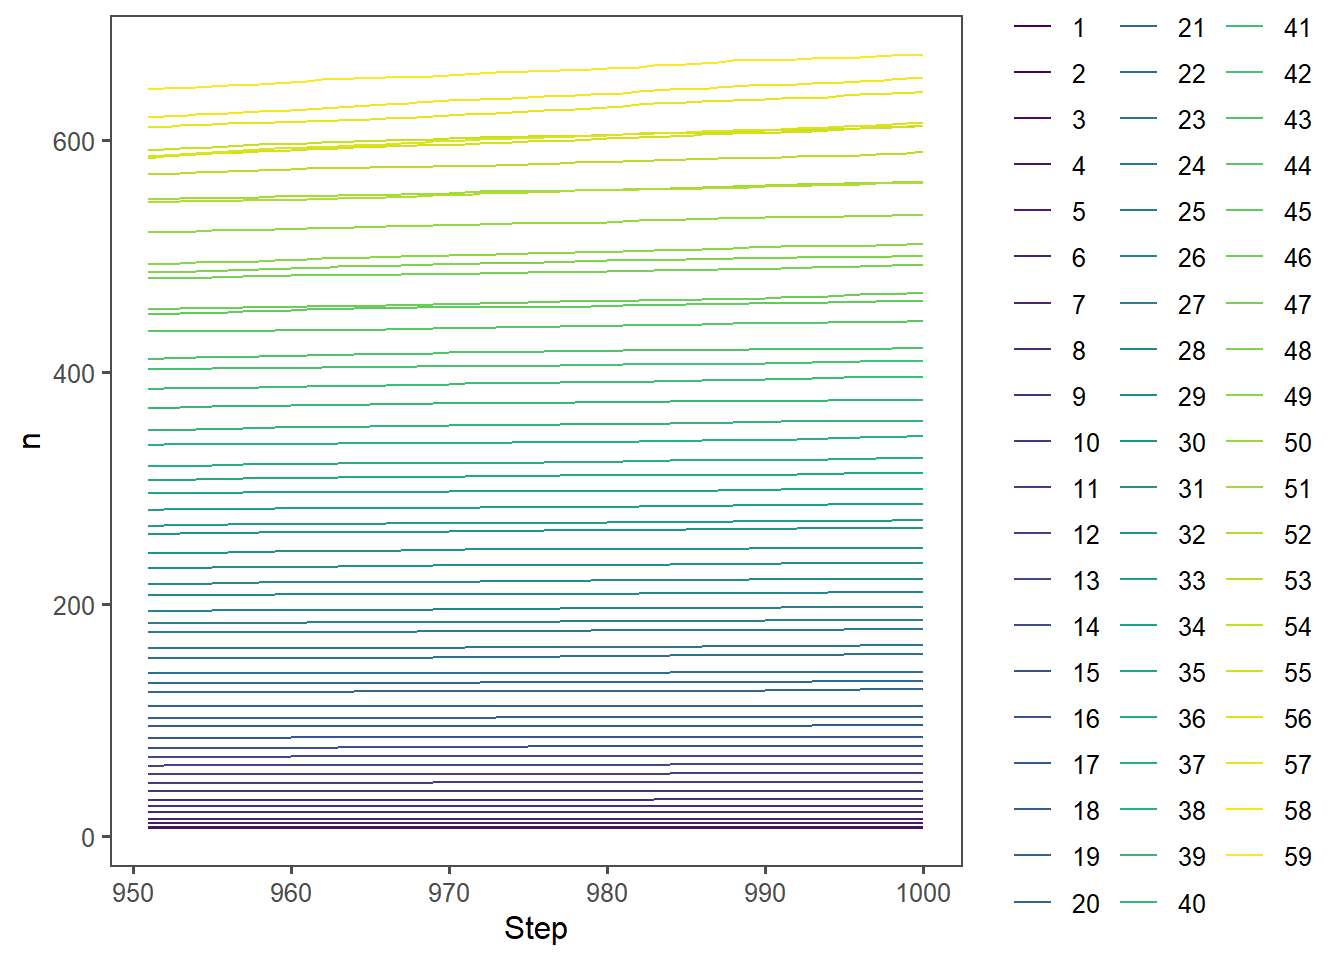
What is the relationship between pen size and stable population?
Kinda linear on the area of the (square pen).
data %>%
  slice_max(order_by = Step, n=1) %>%
  group_by(width) %>%
  summarise(n=mean(n)) %>%
  ungroup() %>%
  mutate(area = width*width) %>%
  ggplot(aes(x=area, y=n)) +
    geom_point()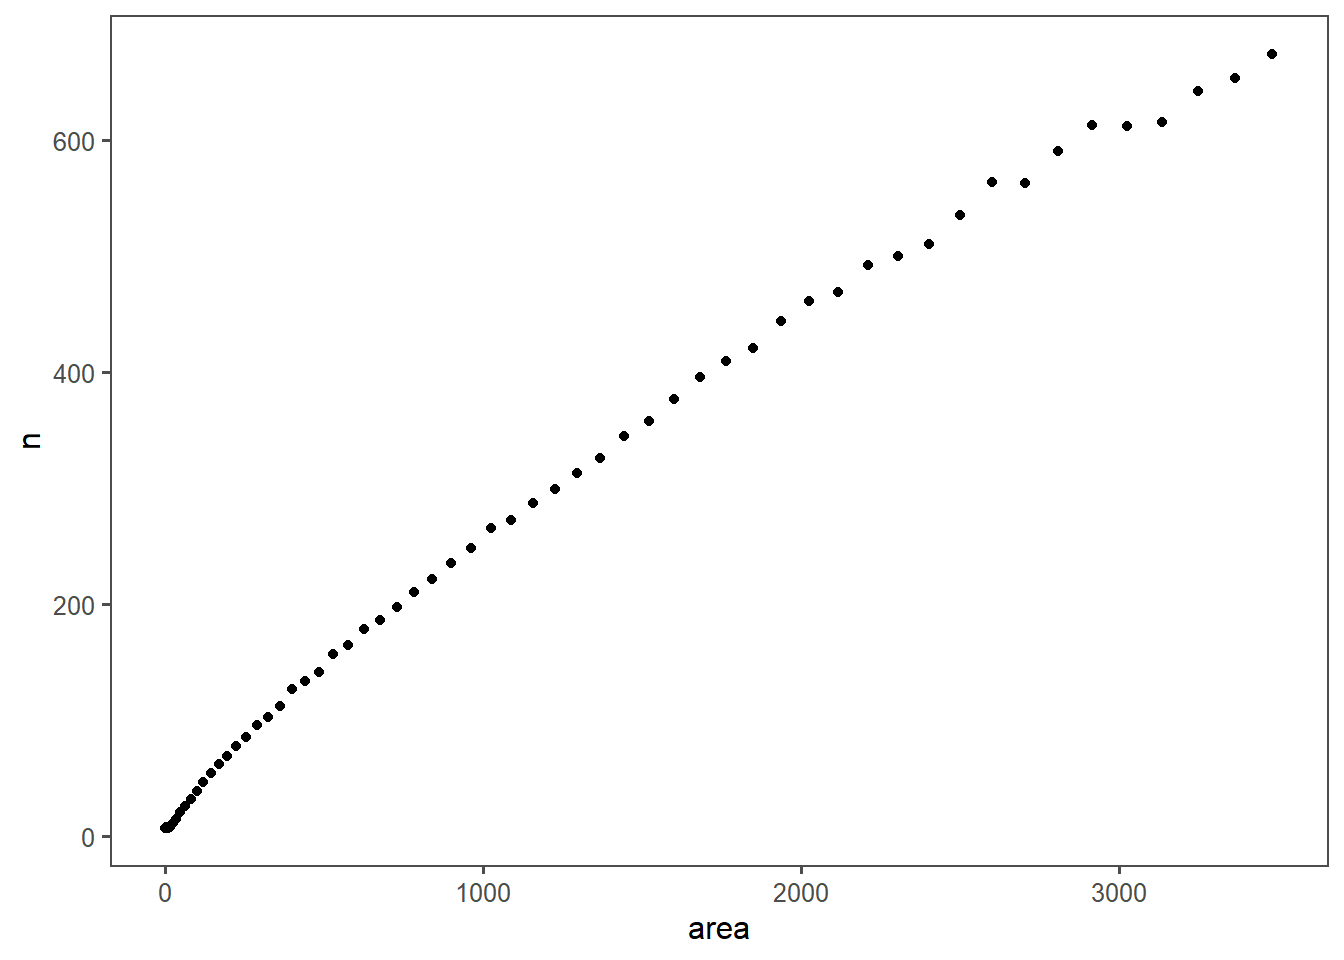
linear_model = data %>%
  slice_max(order_by = Step, n=1) %>%
  group_by(width) %>%
  summarise(n=mean(n)) %>%
  ungroup() %>%
  mutate(area = width*width) %>%
  lm(n~area, data=.)

broom::glance(linear_model) %>%
knitr::kable()| r.squared | adj.r.squared | sigma | statistic | p.value | df | logLik | AIC | BIC | deviance | df.residual | nobs |
|---|---|---|---|---|---|---|---|---|---|---|---|
| 0.9893311 | 0.989144 | 21.98826 | 5285.646 | 0 | 1 | -265.04 | 536.0801 | 542.3127 | 27558.56 | 57 | 59 |
broom::tidy(linear_model) %>%
knitr::kable()| term | estimate | std.error | statistic | p.value |
|---|---|---|---|---|
| (Intercept) | 37.5699758 | 4.3171261 | 8.702543 | 0 |
| area | 0.1974302 | 0.0027156 | 72.702451 | 0 |
Or as a picture:
data %>%
  slice_max(order_by = Step, n=1) %>%
  group_by(width) %>%
  summarise(n=mean(n)) %>%
  ungroup() %>%
  mutate(area = width*width) %>%
  ggplot(aes(x=area, y=n)) +
    geom_point() +
    geom_smooth(method = lm)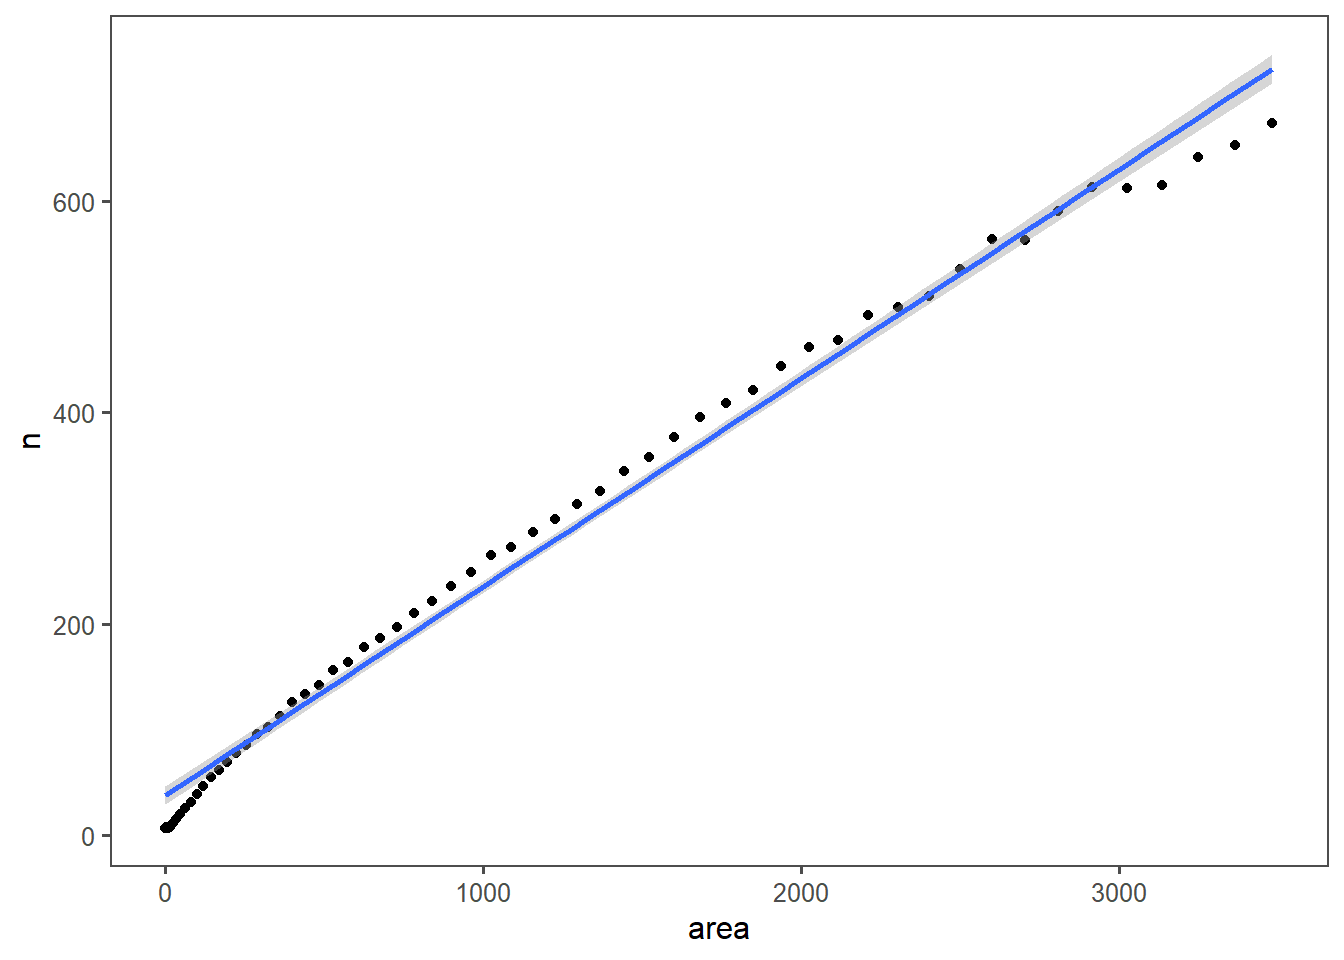
This overestimates at the top end of the pig pen size, but we have reason to believe the model hadn’t reached its stable point there. The top end also spends almost the entire render distance as the pig pen, and would produce far too many piggies, and consume too many veggies.
Our actual pig pen is almost square, so I’ll go compare what my model predicts against what the game believes.
Energy willing, this is part 1.