All map projections are lossy, so there’s always a choice in what you preserve.
Or to reframe it, what features you draw attention to.
Mercator projection preserves angles, which is really handy if you’re trying to sail in a straight line across the Atlantic and reach your port.
I see the handy “you are here” maps around Leeds, with their neat circles showing “approx 5 minutes walk” and know that isochrones are not neat circles.
But what if they were?
I had to go under the hood of the {valhallr} package again. I might need to offer to take over maintenance of the package.
Valhalla server can return the tree it calculated in making an isochrone, so I tweaked the isochrone function to go to that API endpoint instead. 1
val_expand_iso = function (from, costing = "pedestrian", contours = c(5, 10,
                                                     15), metric = "min", min_road_class = "residential", minimum_reachability = 500,
          hostname = "localhost", port = 8002)
{
  if (nrow(from) > 1)
    stop("More than one location supplied. Please supply a one-row input tibble with `lat` and `lon` columns.")
  if (!(("lat" %in% names(from)) & ("lon" %in% names(from))))
    stop("From tibble must inclide one column named `lat` and one named `lon`.")
  if (!metric %in% c("min", "km"))
    stop("Invalid metric. Please use `min` for time in minutes or `km` for distance in kilometres.")
  post_data <- list()
  post_data$locations <- dplyr::select(from, "lat", "lon")
  post_data$costing <- costing
  if (metric == "min")
    post_data$contours <- tibble::tibble(time = contours)
  if (metric == "km")
    post_data$contours <- tibble::tibble(distance = contours)

  post_data$action = "isochrone"
  post_data$skip_opposites = TRUE
  post_data$expansion_properties = c( "durations")
  post_json <- jsonlite::toJSON(post_data, auto_unbox = TRUE)
  post_json = str_replace(post_json, '"durations"', '["durations"]')
  url <- paste0("http://", hostname, ":", port, "/expansion")
  resp <- httr::POST(url = url, body = post_json, httr::user_agent("https://github.com/chris31415926535/valhallr"))
  if (httr::http_type(resp) != "application/json")
    stop("API did not return json.", call. = FALSE)
  if (httr::http_error(resp)) {
    message("Error: API call returned error. Returning API response for debugging.")
    return(resp)
  }
  resp_data <-
  httr::content(resp, type = "text", encoding = "UTF-8") %>%
    geojsonsf::geojson_sf() %>% tibble::as_tibble() %>%
    sf::st_as_sf()# %>%
  resp_data$costing <- costing
  return(resp_data)
}
tmap_mode("plot")

limit = 30

origin = tibble(lat = 53.79806, #t'office
                lon = -1.53158)

# yes, my home server is a homage to Gibson & Wargames movie
data = val_expand_iso(origin, contours = limit, hostname = "gibson.local") %>%
  st_cast("LINESTRING")
The unmodified/use GB grid like a normal person version of the map follows:
data$durations = jsonlite::fromJSON(data$durations[1])

data = data %>%
  mutate(durations = durations/60) %>%
  filter(durations < limit)

data = origin %>%
  st_as_sf(coords = c("lon", "lat"), crs="EPSG:4326") %>%
  st_cast("LINESTRING") %>%
  mutate(durations=0) %>%
  bind_rows(data) %>%
  st_transform("EPSG:27700")

data %>%
  filter(durations>0) %>%
  tm_shape() + tm_lines(col="durations")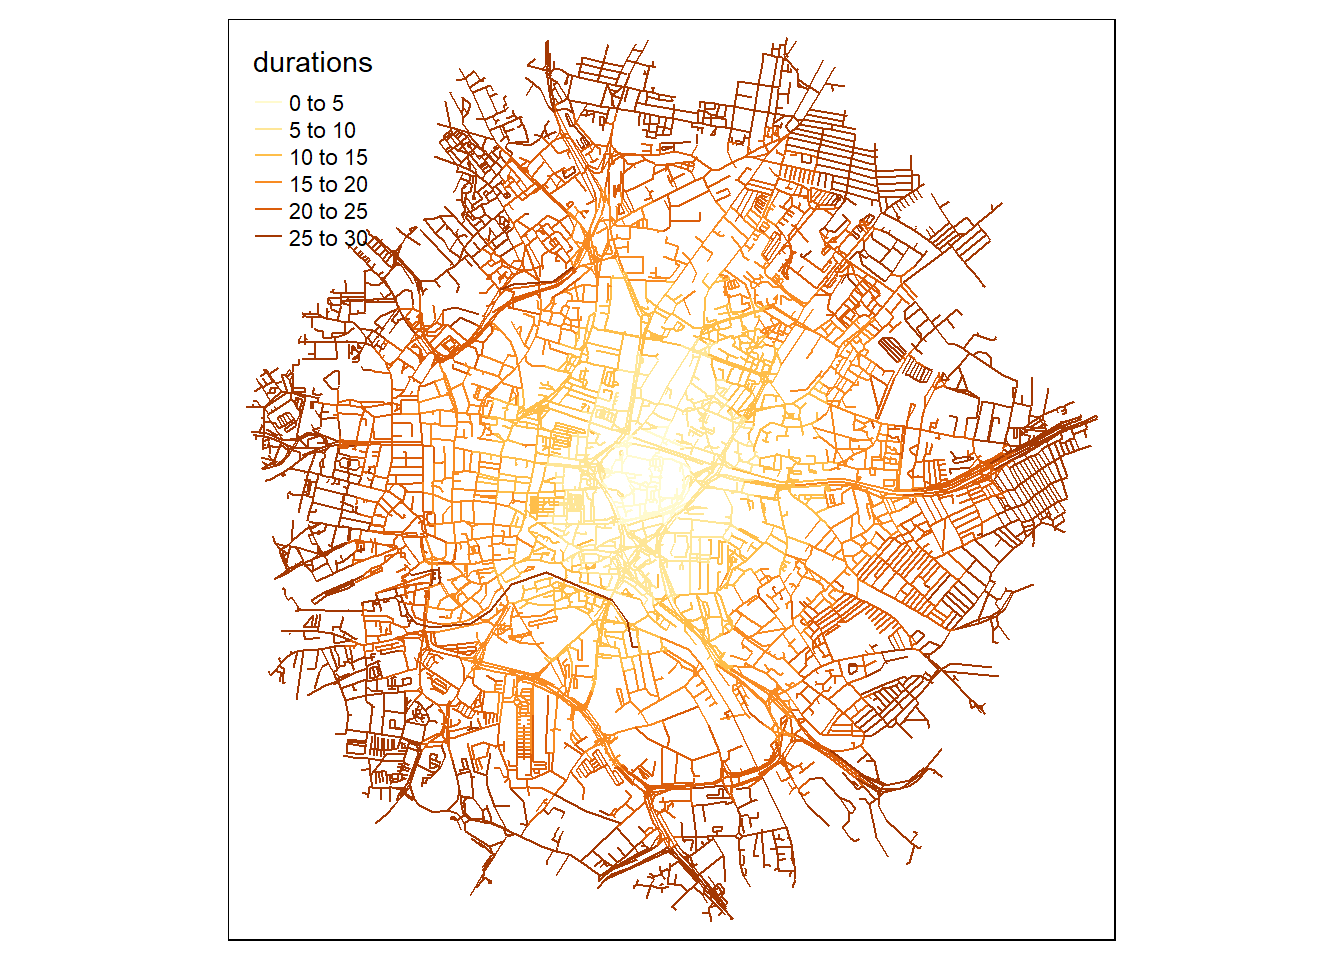
And ‘reprojected’ so that points that are equal time from the origin are equally far from the origin.
origin = st_as_sf( tibble(lat = 53.79806,
                          lon = -1.53158), coords=c("lon", "lat"), crs="EPSG:4326") %>%
  st_transform("EPSG:27700")


to = data %>%
  filter(durations>0) %>%
  mutate(id=row_number()) %>%
  st_cast("POINT") %>%
  distinct() %>%
  mutate(n=n(), .by=id) %>%
  filter(n>=2) %>%
  mutate(p = row_number())

#make repeated points have the same durations/r
to = st_coordinates(to) %>%
  as_tibble() %>%
  mutate(p = row_number()) %>%
  left_join(to, by="p") %>%
  group_by(X,Y) %>%
  mutate(durations=mean(durations)) %>%
  ungroup() %>%
  st_as_sf()

geom = st_geometry(to)
origin = st_geometry(origin)

r = st_distance(st_set_crs(geom - origin, "EPSG:27700"), origin) %>%
  as.vector()


to =
  st_set_geometry(to, (geom-origin)*to$durations + origin) %>%
  group_by(id) %>%
  summarise(durations=first(durations), do_union=TRUE) %>%
  st_set_crs("EPSG:27700") %>%
  st_cast("LINESTRING")


tm_shape(to) + tm_lines(col="durations")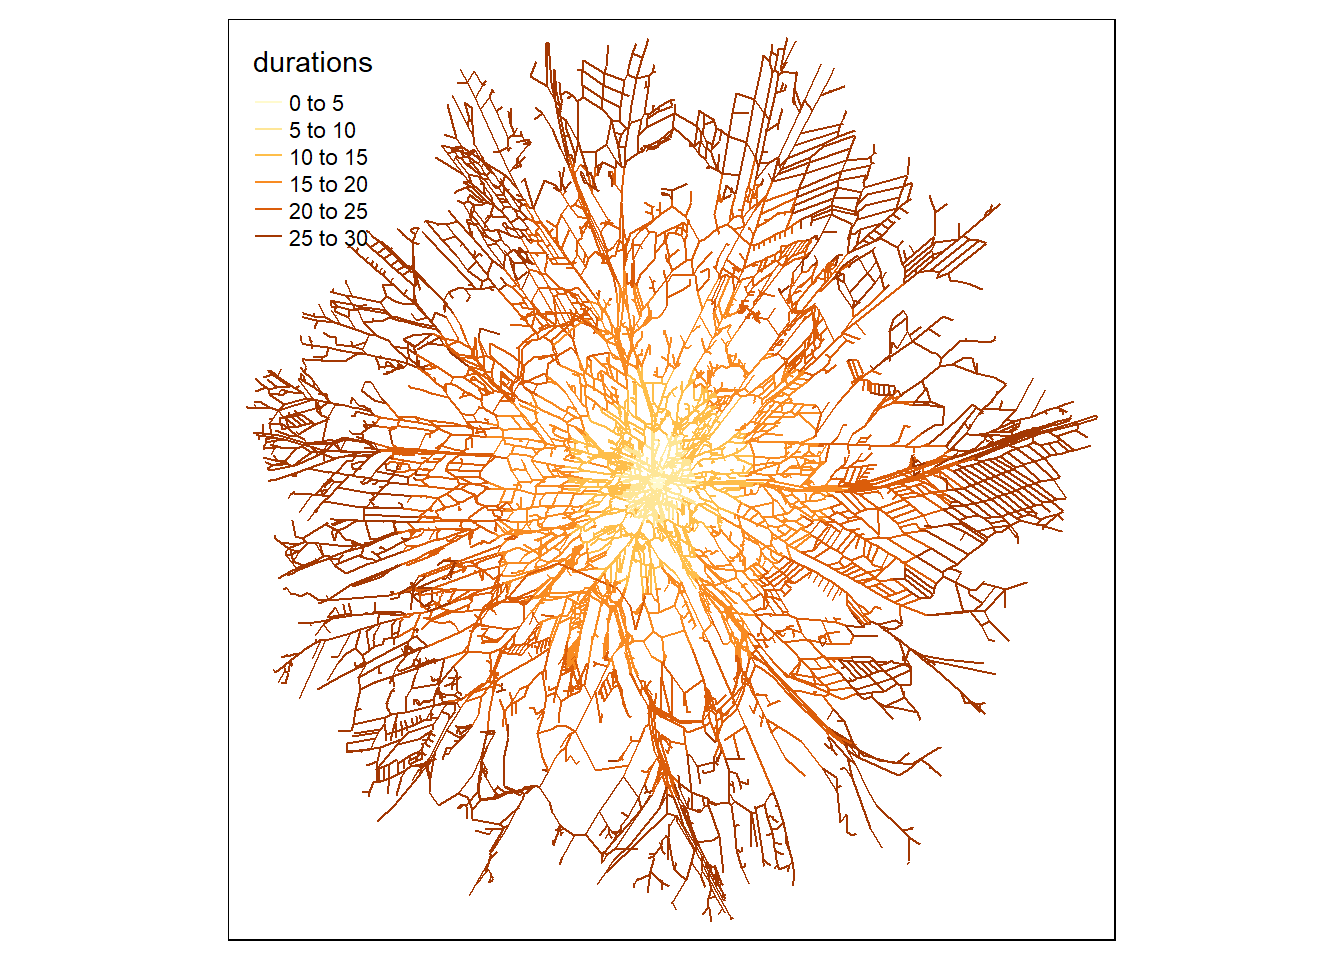
This has already taken long enough. I was going to add the coffee shops from OSM into both maps, but I have a lot going on right now. Consider this a part 1, but I’m not obliging myself to finish part 2.
There’s a minor kludge in there - it’s not clear if duration applies to the start or end of a road segment. So roads kept ending up disjointed.
To keep roads connected points that have the same coordinates before transformation need to have the same coordinates post-transformation, so I:
- split roads into their start and end points;
- initially give both points the duration attached to the road segment;
- gave each point the average duration across all its instances;
- merged them back into lines.
Editing code that almost does what you want is so much easier than writing from scratch.↩︎