Tabletop RPGs tend to make a simplification that the world exists in 5-foot squares, which is OK in one dimension:
tibble(x=c(0,120), label=c("Wizard", "Person about \nto be on fire")) %>%
  ggplot(aes(x=x,label=label,y=0)) + geom_label()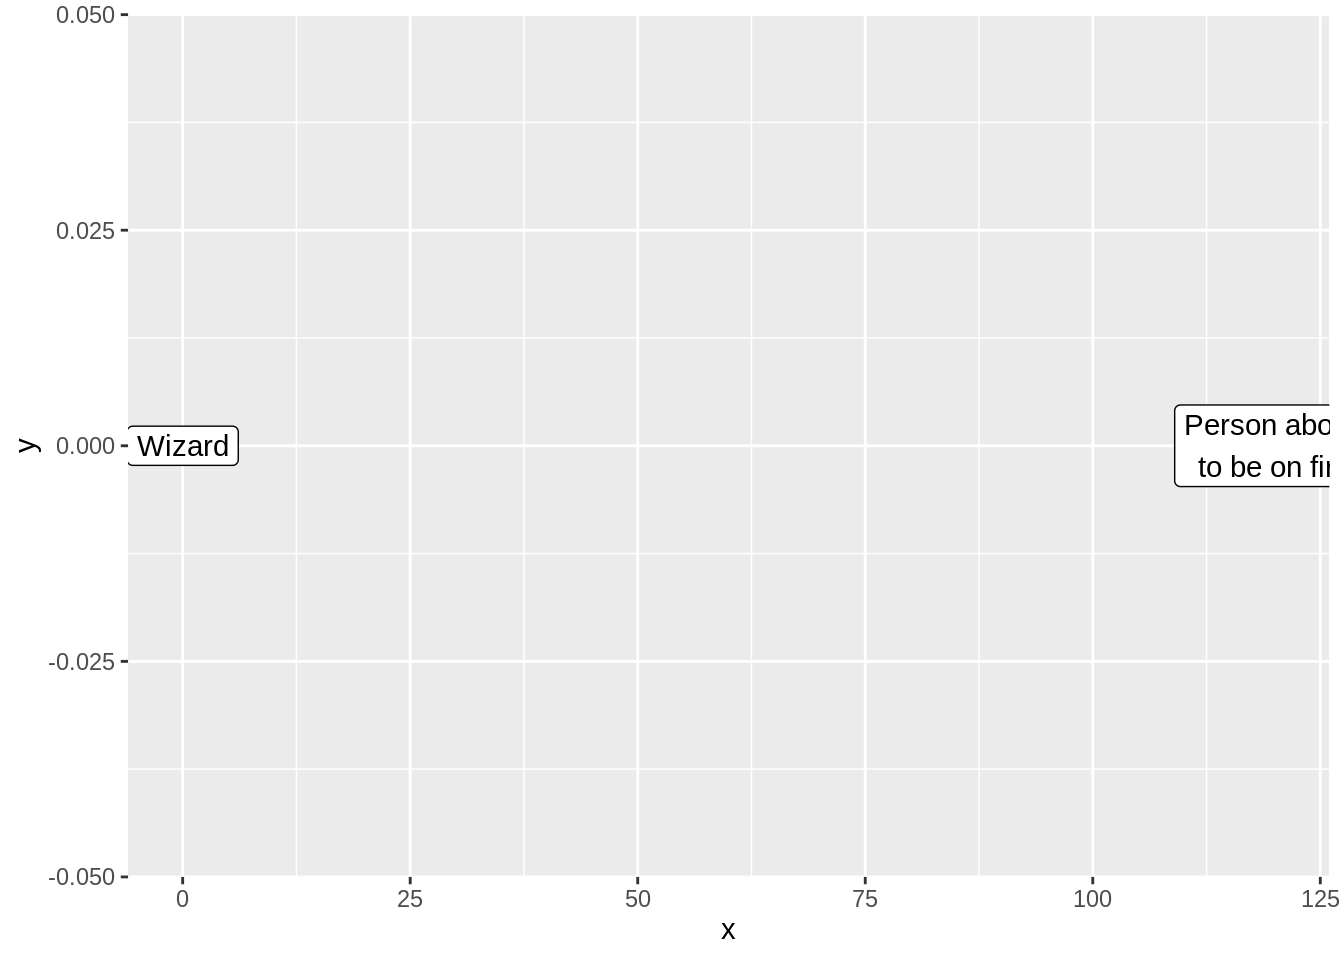
But diagonals are an issue.
Right now the default plot is an issue.
breaks <- function(limits){
  print(limits)
  seq(from=limits[1], to=limits[2], by=5)
}

move_to_center <- function(data){
  data %>%
    mutate(x=x+2.5, y=y+2.5)
}
tibble(x=c(0,120), y=0, label=c("Wizard", "Person about \nto be on fire")) %>%
  move_to_center() %>%
  ggplot(aes(x=x,y=y,colour=label)) + geom_point() + theme_linedraw()  +
  scale_x_continuous(breaks=seq(0,120,by = 5), minor_breaks = NULL) +
  scale_y_continuous(breaks=seq(0,5, by=5), minor_breaks = NULL, limits=c(0,5)) + coord_fixed()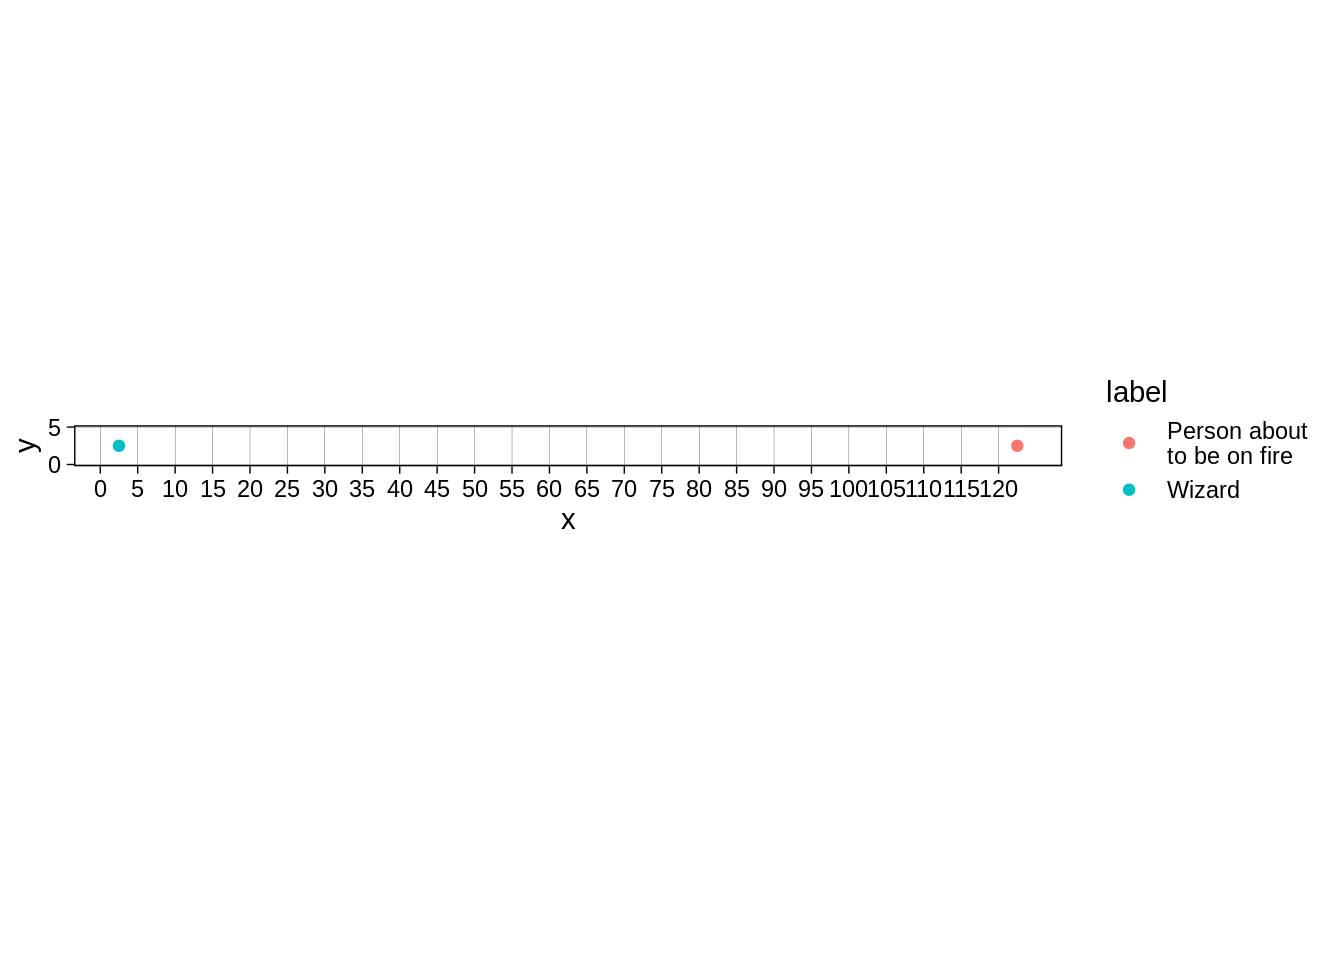
Another modelling assumption in tabletop RPGs - a character fills their 5-foot square:
transform_to_rectangle <- function(data){
  data  %>%
    mutate(xmin=x,ymin=y,xmax=xmin+5,ymax=ymin+5)
}
tibble(x=c(0,120), y=0, label=c("Wizard", "Person about \nto be on fire")) %>%
  transform_to_rectangle() %>%
  ggplot(aes(xmin=xmin,ymin=ymin,xmax=xmax,ymax=ymax, fill=label)) + geom_rect() + theme_linedraw()  +
  scale_x_continuous(breaks=seq(0,120,by = 5), minor_breaks = NULL) +
  scale_y_continuous(breaks=seq(0,5, by=5), minor_breaks = NULL, limits=c(0,5)) + coord_fixed()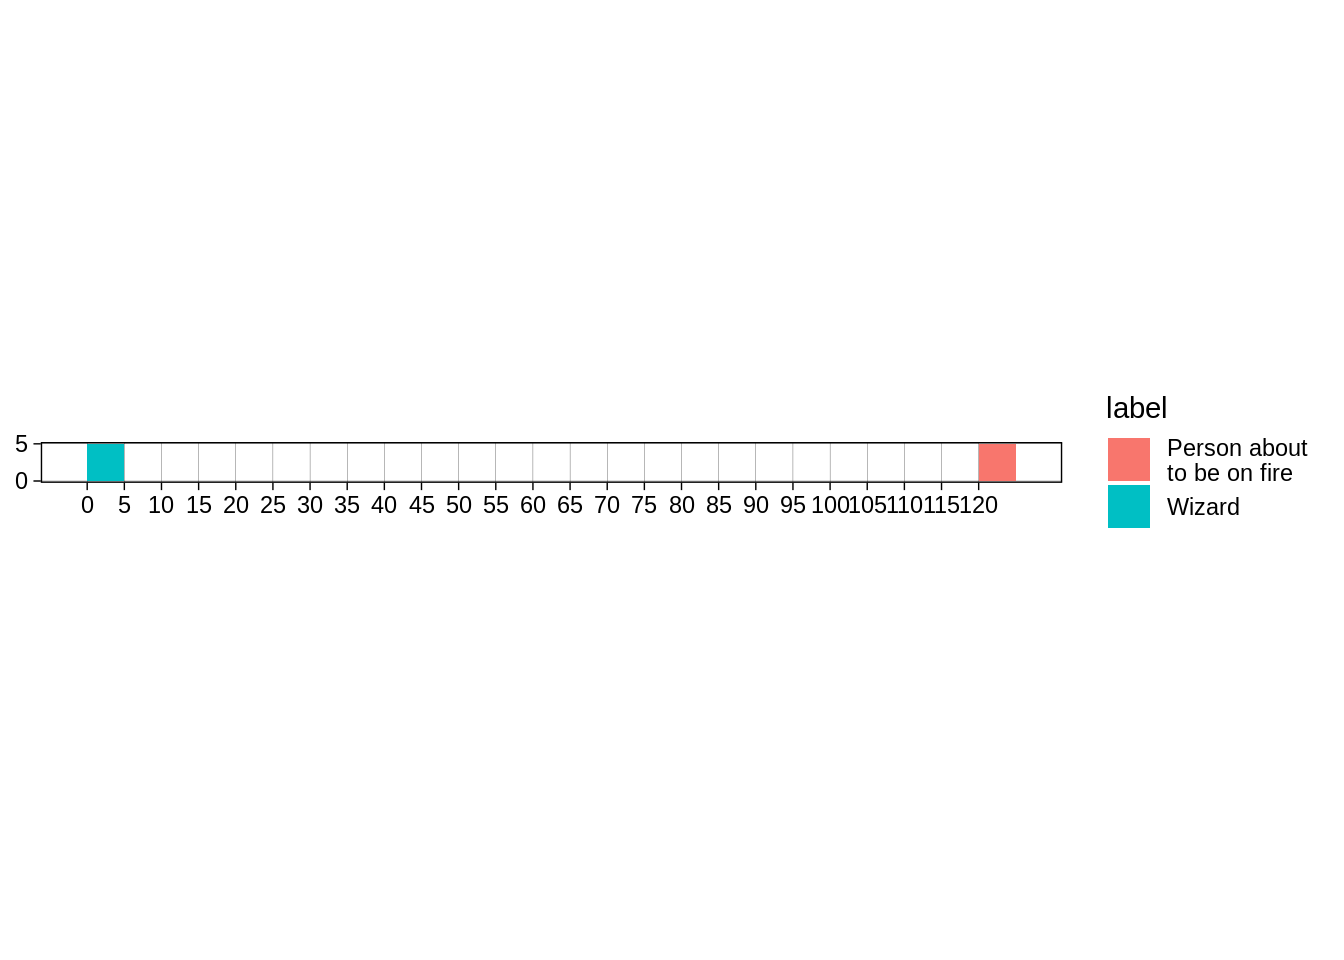
But sometimes the wizard wants to shoot someone who is diagonal to them on the grid.
Euclid would say that our wizard can fire bolt someone inside this circle:
tibble(t = seq(0,2*pi,length.out = 1000), x=120*cos(t), y=120*sin(t)) %>%
  select(-t) %>%
  ggplot(aes(x=x,y=y)) + geom_path() + theme_linedraw()  +
  scale_x_continuous(breaks=seq(-120,120,by = 20), minor_breaks = seq(-120,120,by = 5)) +
  scale_y_continuous(breaks=seq(-120,120, by=20), minor_breaks = seq(-120,120,by = 5)) + coord_fixed() + geom_point(aes(x=2.5,y=2.5, colour="Wizard"))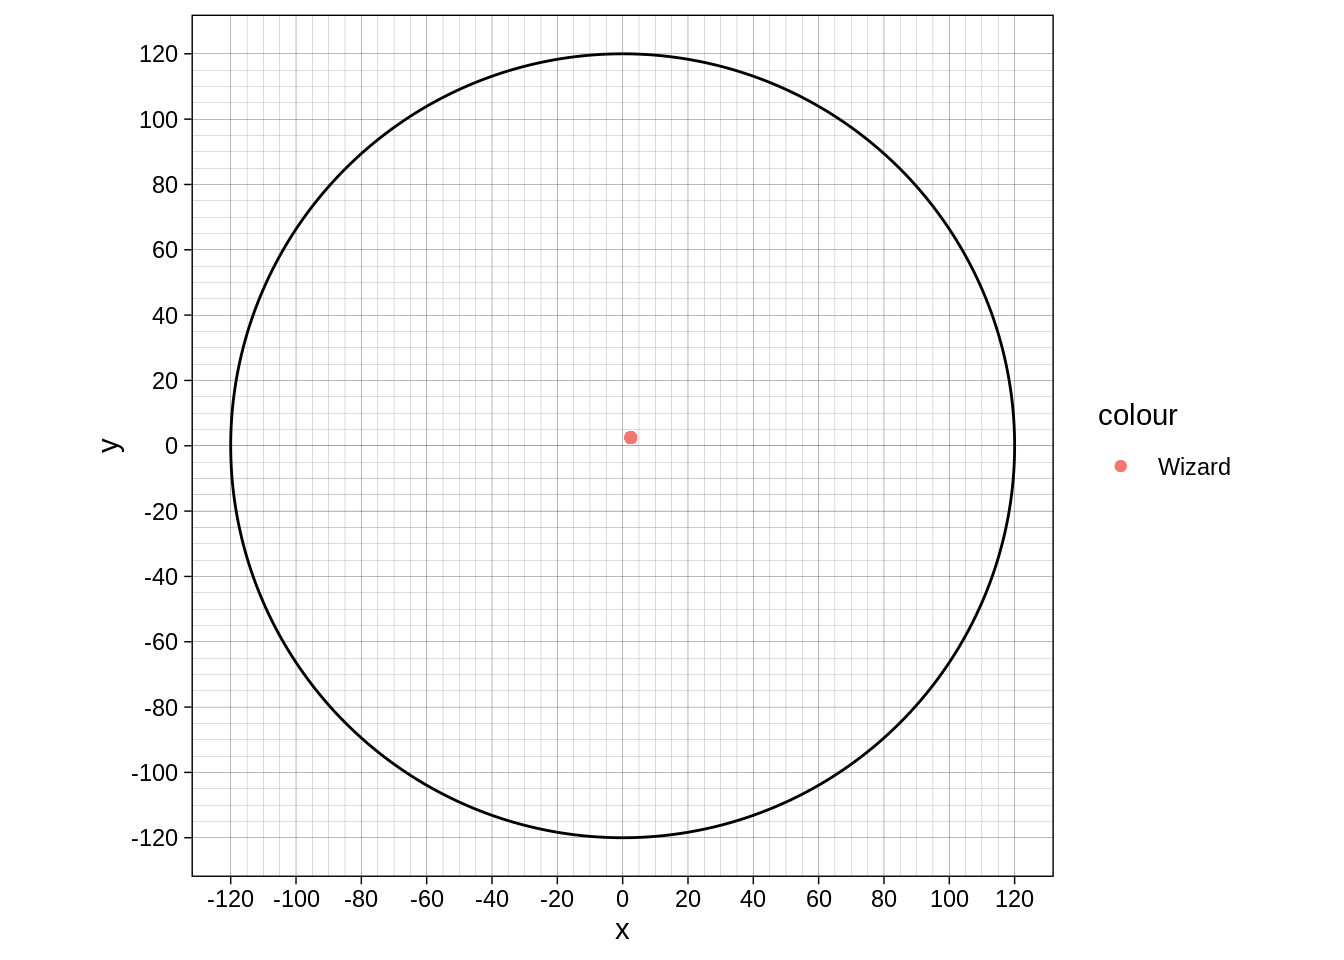
120’ is too much to show the gap, so let’s move to our cleric with his 60’ Sacred Flame:
tibble(t = seq(0,2*pi,length.out = 1000), x=60*cos(t), y=60*sin(t)) %>%
select(-t) %>%
ggplot(aes(x=x,y=y)) + geom_path() + theme_linedraw() +
scale_x_continuous(breaks=seq(-60,60,by = 20), minor_breaks = seq(-60,60,by = 5)) +
scale_y_continuous(breaks=seq(-60,60, by=20), minor_breaks = seq(-60,60,by = 5)) + coord_fixed() + geom_point(aes(x=2.5,y=2.5, colour="Cleric"))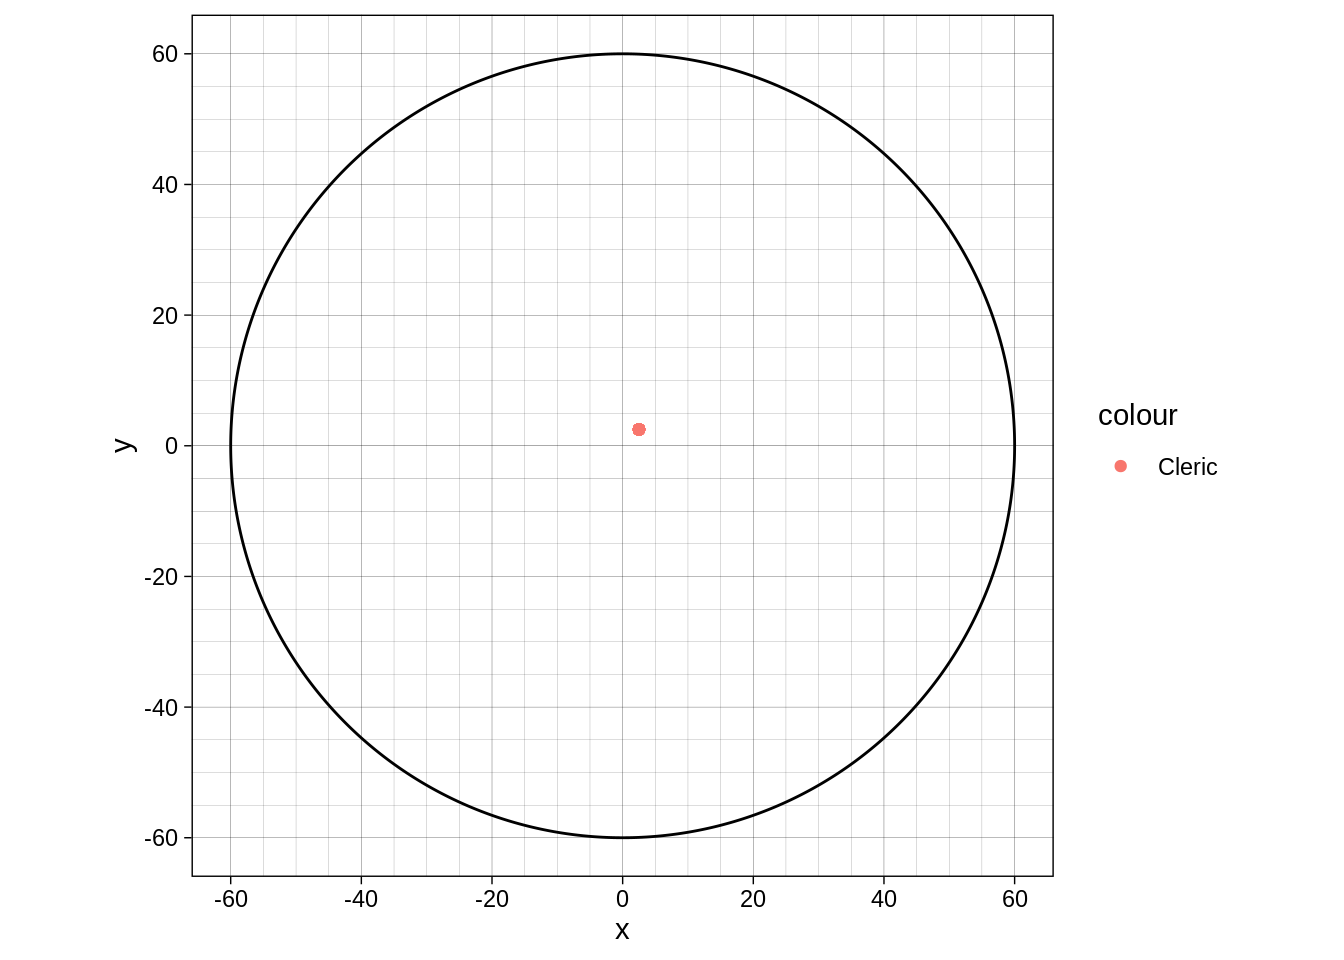 The problem, more or less, is “is the monster in range?”:
tibble(t = seq(0,2*pi,length.out = 1000), x=60*cos(t), y=60*sin(t)) %>%
  select(-t) %>%
  ggplot(aes(x=x,y=y)) + geom_path() + theme_linedraw()  +
  scale_x_continuous(breaks=seq(-60,60,by = 20), minor_breaks = seq(-60,60,by = 5)) +
  scale_y_continuous(breaks=seq(-60,60, by=20), minor_breaks = seq(-60,60,by = 5)) + coord_fixed() + geom_point(aes(x=2.5,y=2.5, colour="Cleric")) + geom_point(aes(x=27.5,y=52.5, colour="Monster"))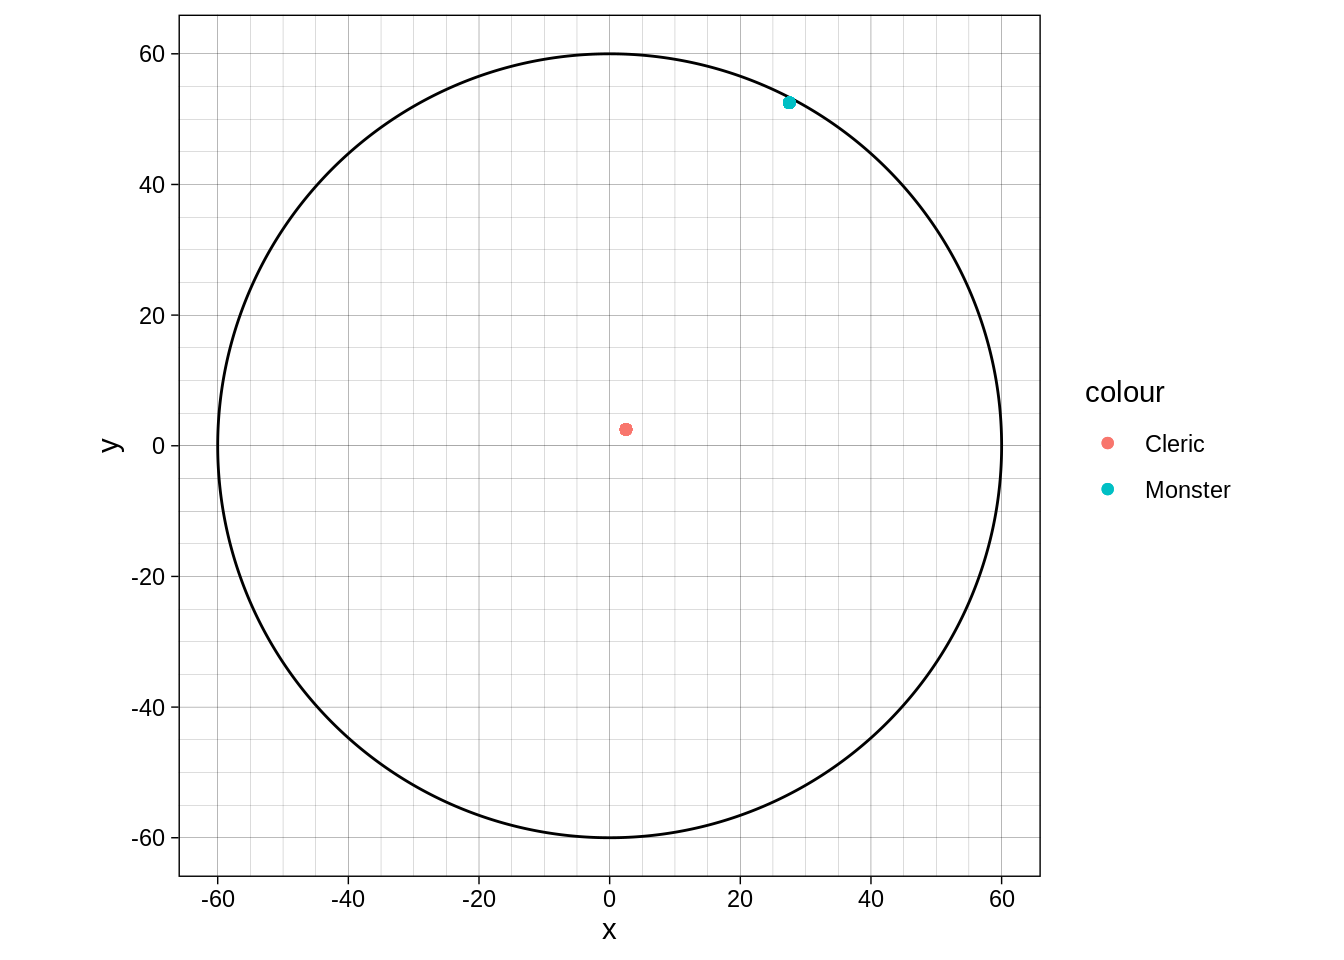
If we say a monster is in range if the center of their tile is in range then this is our cleric’s range:
grid_cleric <-
  cross_df(list(x=seq(-70,70,by=5), y=seq(-70,70,by=5)))

grid_cleric %>%
  mutate(in_range = sqrt(x^2+y^2) < 60) %>%
  filter(in_range) %>%
  mutate(in_range = "about to be set on fire") %>%
  transform_to_rectangle() %>%
  ggplot(aes(xmin=xmin,ymin=ymin,xmax=xmax,ymax=ymax, fill=in_range)) + geom_rect() + theme_linedraw()  +
  scale_x_continuous(breaks=seq(-70,70,by = 5), minor_breaks = NULL) +
  scale_y_continuous(breaks=seq(-70,70, by=5), minor_breaks = NULL) + coord_fixed()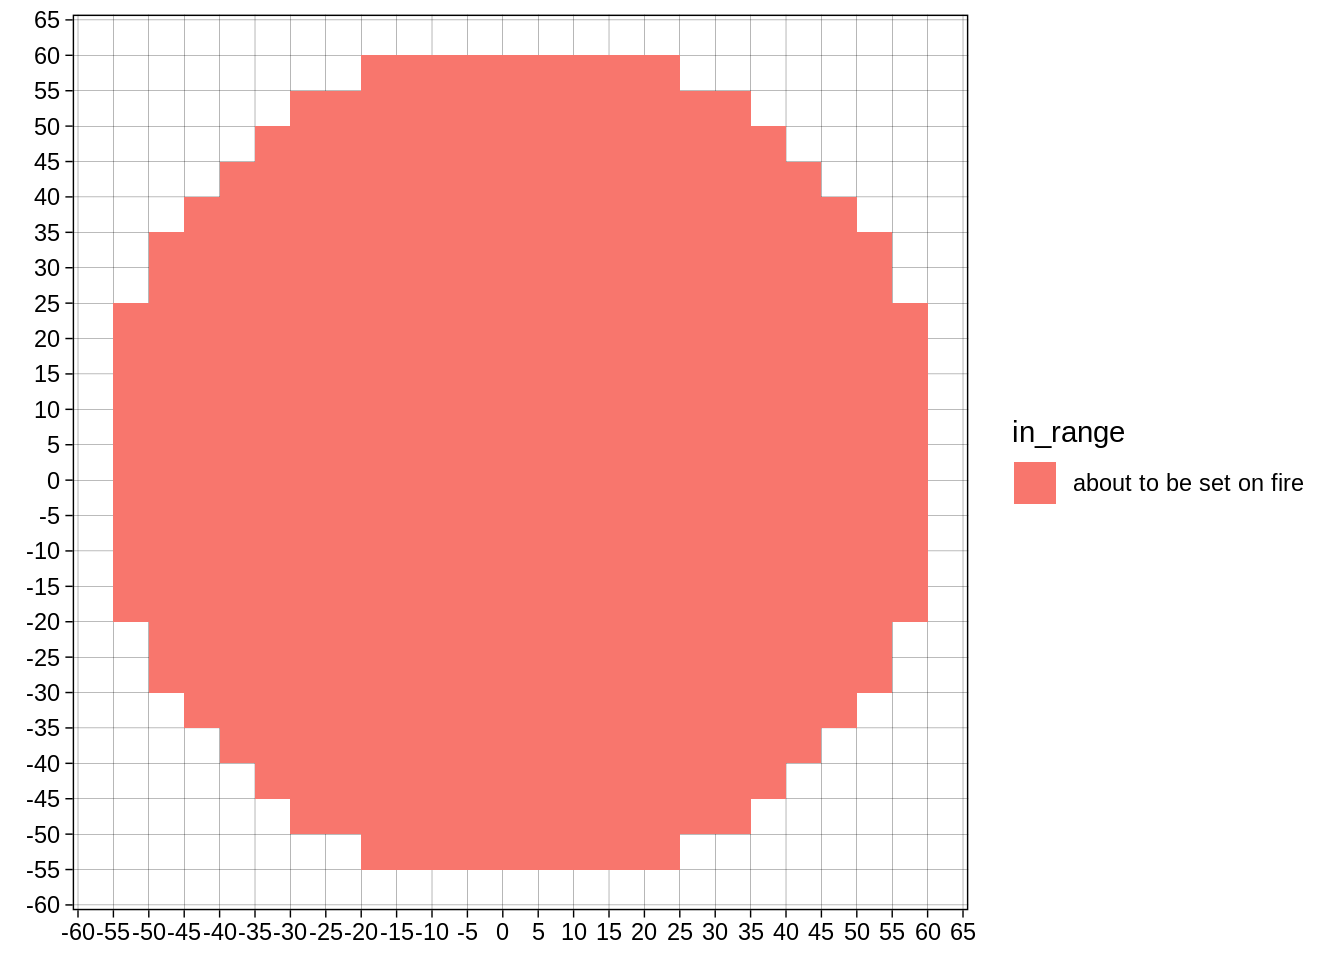
Or for our fire-loving wizard:
grid_wizard <-
  cross_df(list(x=seq(-130,130,by=5), y=seq(-130,130,by=5)))

grid_wizard %>%
  mutate(in_range = sqrt(x^2+y^2) < 120) %>%
  filter(in_range) %>%
  mutate(in_range = "about to be set on fire") %>%
  transform_to_rectangle() %>%
  ggplot(aes(xmin=xmin,ymin=ymin,xmax=xmax,ymax=ymax, fill=in_range)) + geom_rect() + theme_linedraw()  +
  scale_x_continuous(breaks=seq(-130,130,by = 20), minor_breaks = NULL) +
  scale_y_continuous(breaks=seq(-130,130,by = 20), minor_breaks = NULL) + coord_fixed()
Aristotle believed that projectiles moved in straight lines with right angles, and we can force that geometry on our RPG. Then the distance from the origin is abs(x) + abs(y). Because Manhattan NY is in that sort of grid this is sometimes called ‘taxicab geometry’.
grid_cleric %>%
  mutate(distance = abs(x) + abs(y)) %>%
  filter(distance < 60) %>%
  mutate(distance = "Do you see that Radiant light above us?") %>%
transform_to_rectangle() %>%
  ggplot(aes(xmin=xmin,ymin=ymin,xmax=xmax,ymax=ymax, fill=distance)) + geom_rect() + theme_linedraw()  +
  scale_x_continuous(breaks=seq(-70,70,by = 5), minor_breaks = NULL) +
  scale_y_continuous(breaks=seq(-70,70, by=5), minor_breaks = NULL) + coord_fixed()
Though I now have this image of a fire bolt that refuses to move diagonally:
fire_bolt_frame <- function(frame){
  if(frame < 60){
    x_t<-frame
    y_t<-0
  }
  else{
    x_t=60
    y_t=frame-60
  }
  tribble(
    ~x, ~y, ~label,
    0, 0, "wizard",
    60, 60, "flammable object",
    x_t, y_t, "fire bolt"
  ) %>%
    mutate(frame = frame)
}
map_dfr(0:120, fire_bolt_frame) %>%
  move_to_center() %>%
  ggplot(aes(x=x,y=y,colour=label)) + geom_point() + transition_manual(frames = frame ) + theme_linedraw()  +
  scale_x_continuous(breaks=seq(-130,130,by = 5), minor_breaks = NULL) +
  scale_y_continuous(breaks=seq(-130,130, by=5), minor_breaks = NULL) + coord_fixed()
Or like this:
fire_bolt_frame <- function(frame){
 x_t = ceiling(frame/2) * 5
 y_t = floor(frame/2) * 5
  tribble(
    ~x, ~y, ~label,
    0, 0, "wizard",
    60, 60, "flammable object",
    x_t, y_t, "fire bolt"
  ) %>%
    mutate(frame = frame)
}
map_dfr(0:24, fire_bolt_frame) %>%
  move_to_center() %>%
  ggplot(aes(x=x,y=y,colour=label)) + geom_point() + transition_manual(frames = frame ) + theme_linedraw()  +
  scale_x_continuous(breaks=seq(-130,130,by = 5), minor_breaks = NULL) +
  scale_y_continuous(breaks=seq(-130,130, by=5), minor_breaks = NULL) + coord_fixed()
DnD 3.5 edition & Pathfinder has diagonals count for 1.5 (round down) distance, which is somewhere between the two extremes above.
pathfinder_grid <-
  tibble(x=0,y=0, dist = 0)

iterate_distances <- function(grid){
  right <- grid %>%
    mutate(x=x+1,dist=dist+1)
  left <- grid %>%
    mutate(x=x-1, dist=dist+1)
  up <- grid %>%
    mutate(y=y+1, dist=dist+1)
  down <- grid %>%
    mutate(y=y-1, dist=dist+1)

  ur <- grid %>%
    mutate(x=x+1,y=y+1, dist=dist+1.5)
  ul <- grid %>%
    mutate(x=x-1,y=y+1, dist=dist+1.5)
  dr <- grid %>%
    mutate(x=x+1,y=y-1, dist=dist+1.5)
  dl <- grid %>%
    mutate(x=x-1,y=y-1, dist=dist+1.5)

  bind_rows(
    grid, right, up, left, down, ur, ul, dr, dl
  ) %>%
    group_by(x,y) %>%
    summarise(dist=min(dist)) %>%
    ungroup()
}for(i in seq(24)){
pathfinder_grid <- iterate_distances(pathfinder_grid)
}In this situation, our wizard’s target zone is:
pathfinder_grid %>%
    mutate(dist=floor(dist)) %>%
    mutate_all(function(x) x*5) %>%
  filter(dist<120) %>%
transform_to_rectangle() %>%
  ggplot(aes(xmin=xmin,ymin=ymin,xmax=xmax,ymax=ymax, fill=dist)) + geom_rect() + theme_linedraw()  +
  scale_x_continuous(breaks=seq(-200,200,by = 5), minor_breaks = NULL) +
  scale_y_continuous(breaks=seq(-200,200, by=5), minor_breaks = NULL) + coord_fixed() +
  scale_fill_viridis_c(option="B")
And our cleric’s is:
In this situation, our wizard’s target zone is:
pathfinder_grid %>%
    mutate(dist=floor(dist)) %>%
    mutate_all(function(x) x*5) %>%
  filter(dist<60) %>%
transform_to_rectangle() %>%
  ggplot(aes(xmin=xmin,ymin=ymin,xmax=xmax,ymax=ymax, fill=dist)) + geom_rect() + theme_linedraw()  +
  scale_x_continuous(breaks=seq(-200,200,by = 5), minor_breaks = NULL) +
  scale_y_continuous(breaks=seq(-200,200, by=5), minor_breaks = NULL) + coord_fixed() +
  scale_fill_viridis_c(option="B")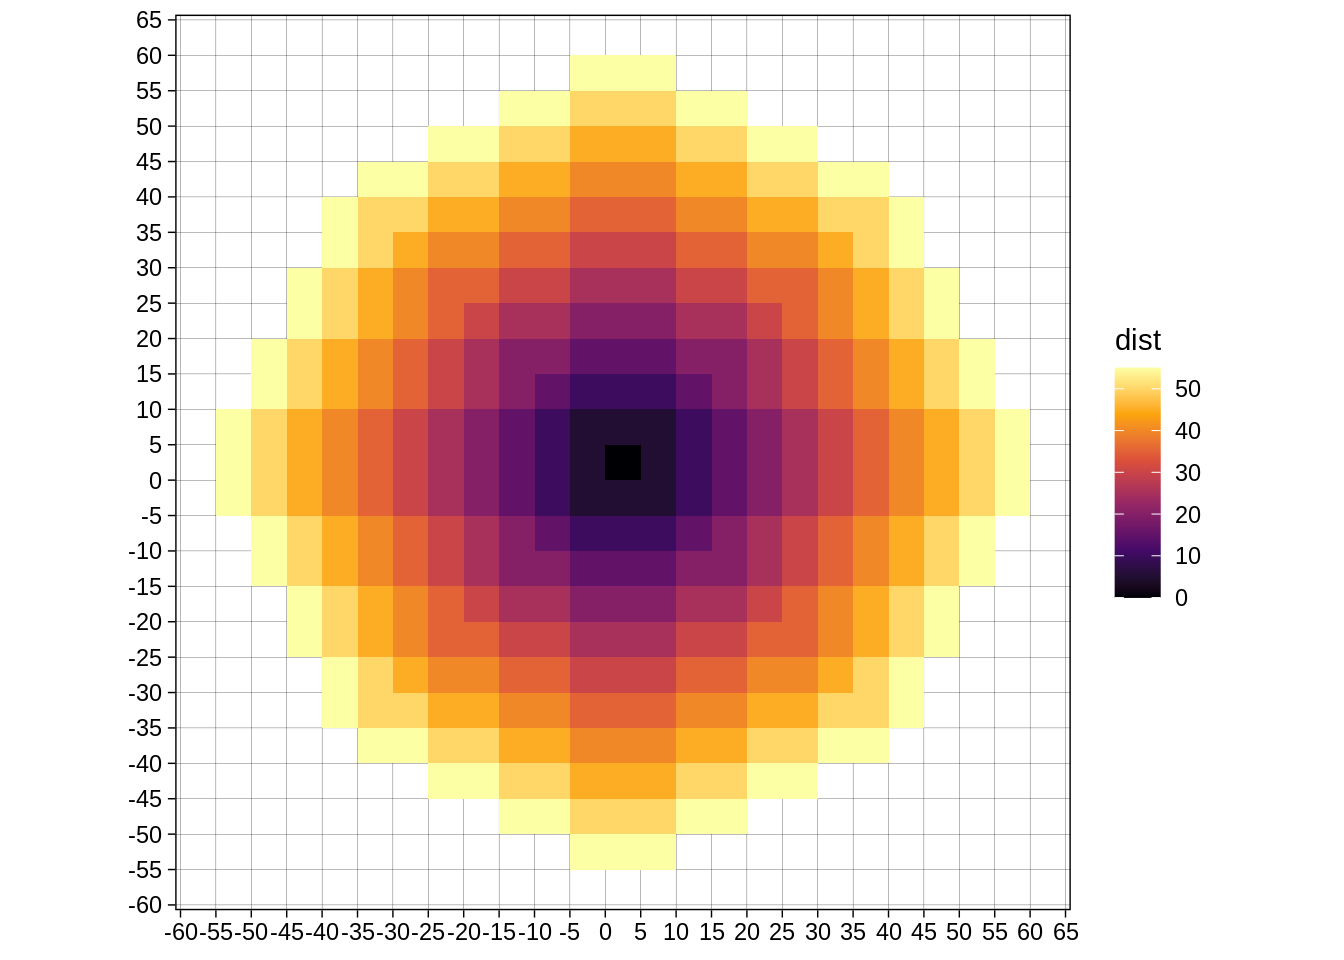
As an animation:
map_dfr(1:20, function(frame){
  pathfinder_grid %>%
    mutate(dist=floor(dist)) %>%
    filter(dist<frame) %>%
    mutate(frame=frame)
}) %>%
  mutate(x=x*5,y=y*5) %>%
  transform_to_rectangle() %>%
  ggplot(aes(xmin=xmin,ymin=ymin,xmax=xmax,ymax=ymax, fill="boom")) + geom_rect() + transition_manual(frame) + theme_linedraw()  +
  scale_x_continuous(breaks=seq(-200,200,by = 5), minor_breaks = NULL) +
  scale_y_continuous(breaks=seq(-200,200, by=5), minor_breaks = NULL) + coord_fixed()