The Background
In my short time in UCU we entered a pay dispute that lead to a series of strike actions. The dispute boiled down to “inflation is eroding our wages, at least pay us as much in real terms as we were worth a few years ago”.
I was a little complicated - I was still a member of NUS who had condemned the strikes. I joined UCU as a postgraduate tutor, and was automatically in NUS as a postgraduate student. I ended up on picket lines on my non-tutoring days because timetables are random and UCU decided on random 1 days.
Anyway, I left for the Public Sector, but I have mates in UCU. Despite UCEA promising to resolve the issues and re-open good-faith negotiations, UCU have felt it necessary to vote for industrial action.
I’ve offered to graph the real-terms cuts to University salaries for one of these mates, and since this blog is Creative Commons Licenced anyone else can grab the graphs
Data
UCEA already have commissioned an independent analysis of the real-terms pay cuts. I’m going with CPIH as it looks at a standard bucket of living costs including housing, and ONS recommend it and I sit next to a Statistician at work.
I plucked the relevant table into a spreadsheet, giving all values in 2008-09 pounds:
pay_data <- read_csv(here::here("static/data/UCU/paycuts.csv"))

pound <- function(x) scales::dollar(x, prefix = "£")

pay_data %>%
  mutate(`Spine Point` = as.character(`Spine Point`)) %>%
  mutate_if(is.numeric, pound) %>%
knitr::kable()| Spine Point | 2008-9 | 2013-14 | 2018-19 | 2019-20 |
|---|---|---|---|---|
| 3 | £16,858 | £15,525 | £16,146 | £16,458 |
| 11 | £20,818 | £19,133 | £19,202 | £19,286 |
| 21 | £27,836 | £25,526 | £25,482 | £25,510 |
| 31 | £37,408 | £34,249 | £34,189 | £34,226 |
| 41 | £50,276 | £45,972 | £45,892 | £45,942 |
| 51 | £67,567 | £61,726 | £61,618 | £61,684 |
As simple line graphs:
parse_year <- function(year) str_extract(year, "^[0-9]+") %>% paste0("-01-01") %>% lubridate::ymd()

pay_data %>%
  pivot_longer(-`Spine Point`, names_to = "year", values_to = "pay") %>%
  mutate(`Spine Point` = as_factor(`Spine Point`)) %>%
  mutate(year =parse_year(year)) %>% #Quick function to turn year into something ggplot recognises as a year
  ggplot(aes(x=year,y=pay, colour=`Spine Point`)) + geom_line() + geom_point() +   ggthemes::theme_tufte() +
  scale_y_continuous(labels=pound) +
  labs(title="All University Pay Bands have seen real cuts")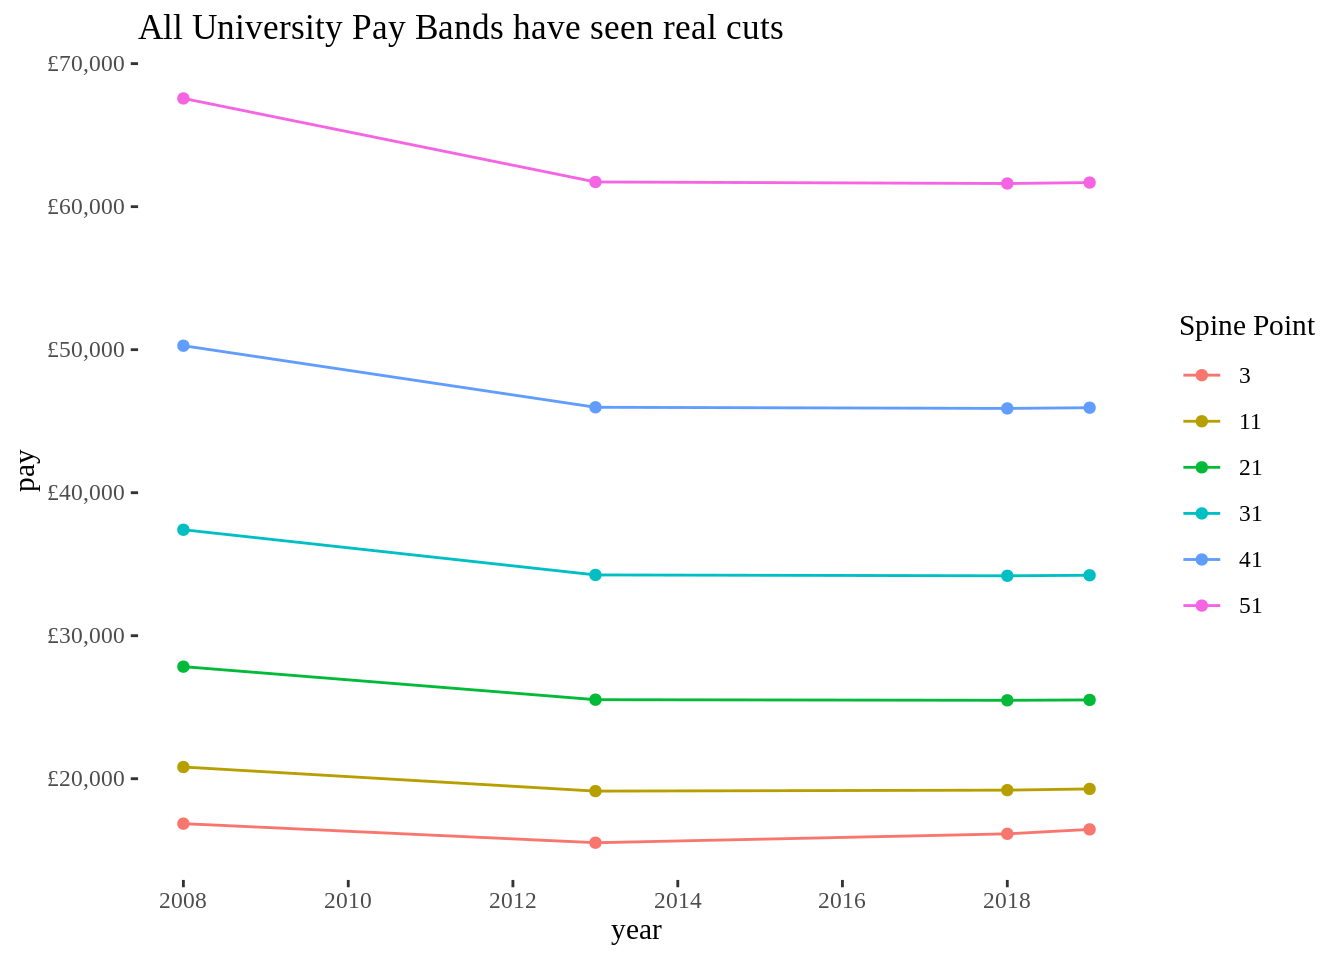
As percentages:
pay_data %>%
 mutate(`Spine Point` = as_factor(`Spine Point`)) %>%
  pivot_longer(-`Spine Point`) %>%
  group_by(`Spine Point`) %>%
  mutate(value = value/first(value)-1) %>%
  ungroup() %>%
  mutate(year = parse_year(name)) %>%
  ggplot(aes(x=year, y=value, colour=`Spine Point`)) + geom_line() + scale_y_continuous(labels = scales::percent) + ggthemes::theme_tufte() + ggthemes::scale_color_few() + labs("Almost everyone is 8% worse off")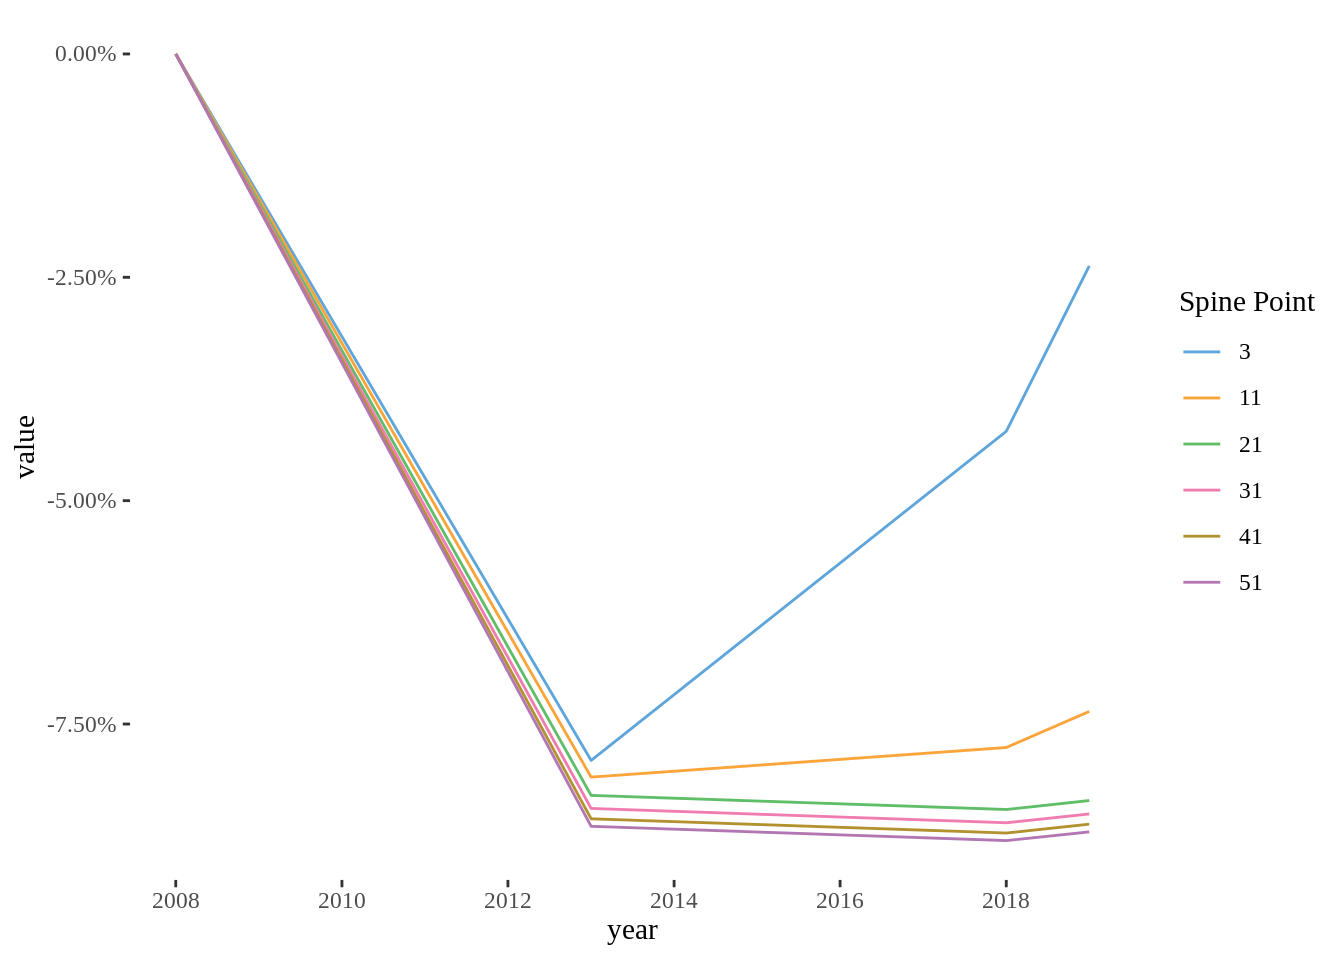
Spine Point 3 saw less cut than the rest, a quick eyeballing suggests that this is because min wage went up, so I’m re-doing the above graph without SP 3 just in case.
pay_data %>%
  filter(`Spine Point`!=3) %>%
  mutate(`Spine Point` = as_factor(`Spine Point`)) %>%
  pivot_longer(-`Spine Point`) %>%
  group_by(`Spine Point`) %>%
  mutate(value = value/first(value)-1) %>%
  ungroup() %>%
  mutate(year = parse_year(name)) %>%
  ggplot(aes(x=year, y=value, colour=`Spine Point`)) + geom_line() + scale_y_continuous(labels = scales::percent) + ggthemes::theme_tufte() + ggthemes::scale_color_few() + labs("Almost everyone is 8% worse off")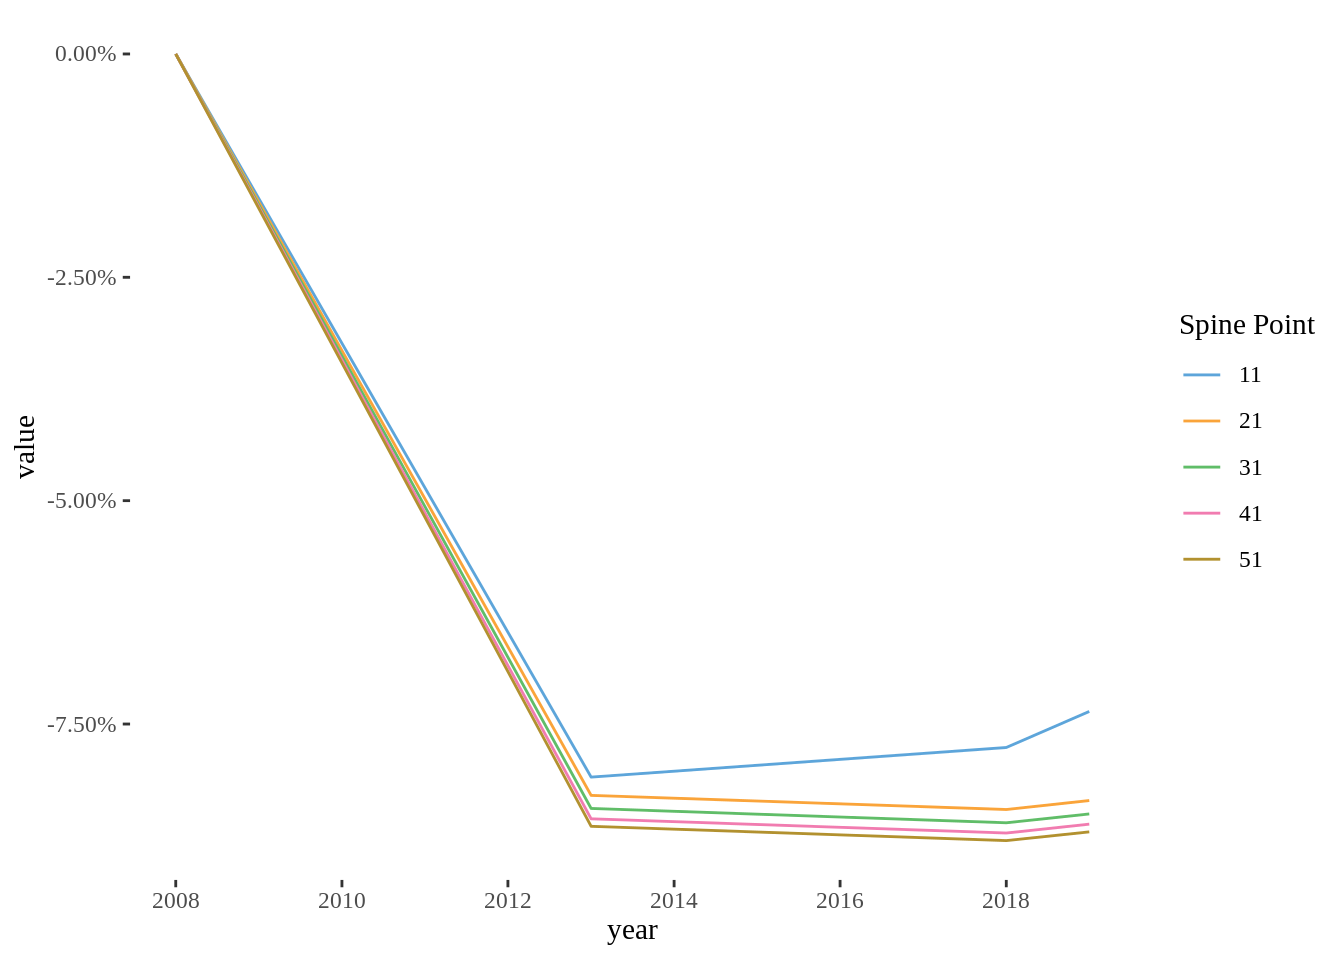
As a table:
pay_data %>%
  mutate(`Spine Point` = as_factor(`Spine Point`)) %>%
  rename(base = `2008-9`) %>%
  pivot_longer(-c(`Spine Point`, base)) %>%
  mutate(value = value/base-1) %>%
  select(`Spine Point`, year=name, value) %>%
  mutate(value = scales::percent(value)) %>%
  pivot_wider(names_from = year, values_from = value) %>%
knitr::kable()| Spine Point | 2013-14 | 2018-19 | 2019-20 |
|---|---|---|---|
| 3 | -7.91% | -4.22% | -2.37% |
| 11 | -8.09% | -7.76% | -7.36% |
| 21 | -8.30% | -8.46% | -8.36% |
| 31 | -8.44% | -8.61% | -8.51% |
| 41 | -8.56% | -8.72% | -8.62% |
| 51 | -8.64% | -8.80% | -8.71% |
As a time comparison - 8% of a 40-hour week is about 3.2 hours, or half a day. “About half a day” holds as long as they’re on a 5-day week, which definitely isn’t universal in Uni. (If >40 hours then each day is longer, and half a day is longer.)
Or compared against 10 years ago, most folk in Universities are effectively working for free for half of Friday.