Five-Thirty-Eight/Riddler
I recognised today’s Riddler problem and recognised that it’s reasonably easy to attack by Monte Carlo testing rather than my (weak) probability/combinatorics.
I’m going to look at solutions of the form “the Sultan’s daughter looks at the first N candidates and chooses the next candidate better than all of them, or else the last candidate”. There are other forms, but this is approximately what I remember from some book.
n_scenarios <- 1e5

candidates <- 1:10 #Say 10 is the best, 1 is the worst.

shuffle <- function(vector){ #Useful to randomise the order of the suitors.
  sample(vector, length(vector))
}

test_scenarios <- map_dfr(seq_len(n_scenarios), function(x){
  tibble(suitor = shuffle(candidates),
  scenario=x,
  order = 1:10)
})
Having set up n_scenarios scenarios I can write a function that takes a scenario and how many candidates she observes before deciding to choose the first one better than any of them, and returns a score from 1 to 10 for how good the suitor is.
score_strategy_once <- function(data, N){
  data %>%
    mutate(observed = suitor * (order <= N)) %>% # It's easiest to take the max observed suitor when the unobserved score 0
    mutate(best_observation = max(observed)) %>%
    filter(order > N) %>% # The ones who can be selected
    filter(suitor > best_observation  | order == 10) %>% # The ones who score better than the 'dating' period, or the last one.
    top_n(-1, order) %>% # The first one, since rejects can't be returned to.
    select(suitor, scenario, best_observation)
}
score_strategy <- function(data, N){
  data %>%
    group_by(scenario) %>%
    score_strategy_once(N) %>%
    ungroup() %>%
    mutate(strategy=N)
}

monte_carlo_tbl <- map_dfr(0:9, ~(score_strategy(test_scenarios, .x)))

monte_carlo_tbl %>%
    group_by(strategy) %>%
    summarise(mean.score=mean(suitor)) %>%
knitr::kable()| strategy | mean.score |
|---|---|
| 0 | 5.50444 |
| 1 | 7.70283 |
| 2 | 8.07327 |
| 3 | 7.98399 |
| 4 | 7.70229 |
| 5 | 7.33290 |
| 6 | 6.91709 |
| 7 | 6.46119 |
| 8 | 5.98481 |
| 9 | 5.50191 |
Sanity check - strategy 0 is “accept the first suitor”, which has an expected value of 5.5 (uniform distribution 1:10).
Based on mean score, look at the first 2, select the best one after that which averages about suitor 8.
monte_carlo_tbl %>%
  rename(score=suitor) %>%
  mutate(score=as_factor(score)) %>%
  mutate(strategy = as.character(strategy)) %>%
  group_by(strategy, score) %>%
  summarise(n=n()) %>%
  mutate(p = n/sum(n)) %>%

  ggplot(aes(x=score,y=strategy, fill=p)) + geom_tile() + scale_fill_viridis_c(option = "B", label=scales::percent) + ggthemes::theme_tufte()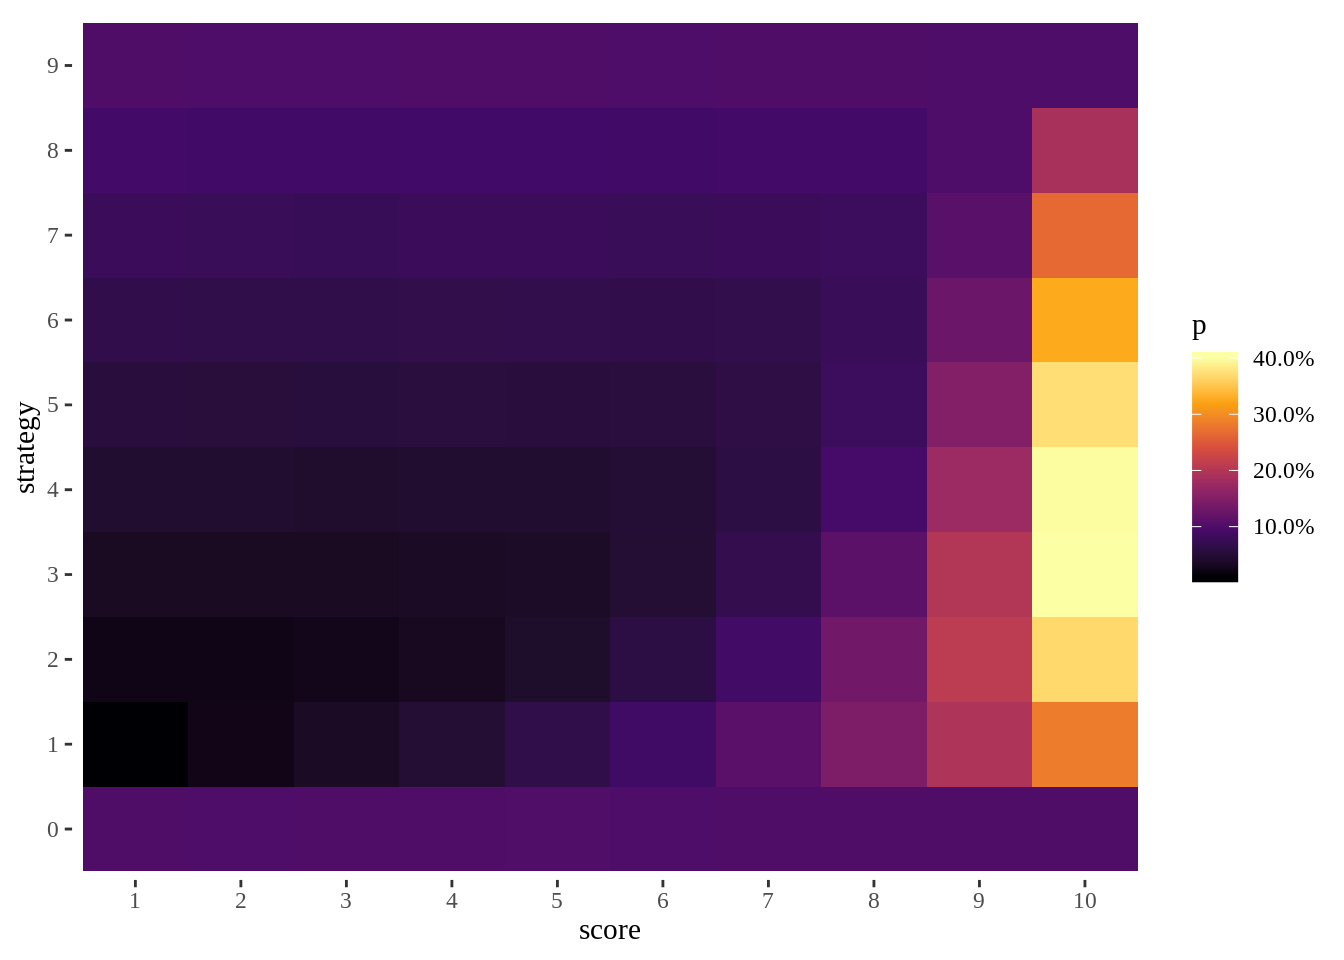
While 2 has the best mean, 3 seems to have the best chance of hitting the best suitor.