Previously, I compared my “big 3” lifts to various competition records. I first got interested in getting fit for a few reasons:
- The connection between exercise and levelling up
- Being fit enough to run around a field in metal or leather armour for a weekend, or LARPing.1
I managed to get an invite to Fitocracy 2 somewhere around Jan 2012, the first workout appears to be logged for 2012-1-10. 3 Weight training is relatively recent, since gyms are expensive and full of other people.
I used this Python3 script to grab my entire Fitocracy log as a pile of json. I dug around it a while, and managed to wrangle it into a sensible data.frame. As with the Spotify data post, you’re not getting the raw data, but some summary stats are cool.
This isn’t my first time playing with the Fito json dump - one year Heroes (premium users) were given a end of year summary, then the next year they weren’t. I tried writing a script to generate the same stats (link to GitHub). It failed in some edge cases, and another Hero wrote a script that actually worked.
First item of curiosity: what activities have given me the most XP.4
JR_fito_data %>%
  group_by(name) %>%
  summarise(points = sum(points)) %>%
  top_n(10, points) %>%
  arrange(-points) %>%
knitr::kable()| name | points |
|---|---|
| SCA Heavy Combat | 120061 |
| Pull-Up | 115617 |
| Barbell Deadlift | 59078 |
| Chin-Up | 35614 |
| Barbell Bench Press | 34653 |
| Barbell Squat | 31933 |
| Cycling | 30065 |
| Standing Barbell Shoulder Press (OHP) | 28055 |
| Ring Dip | 25284 |
| Standing Military Press | 17832 |
By ‘SCA Heavy Combat’ I mean “LARPing”. It once was listed as an alias in the tracking page, but not any more. It makes me happy that most of my fitness XP is from RPGs.
Pull-Ups are basically the same thing as Chin-Ups, and OHP is essentially the same thing as Military Press, but I’m not tidying this dataset by what’s too similar to other stuff.
Least points?
JR_fito_data %>%
  group_by(name) %>%
  summarise(points = sum(points)) %>%
  top_n(-10, points) %>%
  arrange(points) %>%
knitr::kable()| name | points |
|---|---|
| Curls in the Squat Rack | -50 |
| Shake Weight | -1 |
| Toe Touches | 4 |
| Band Windmill | 5 |
| Incline Push-Up | 5 |
| Seated Hamstring Stretch | 5 |
| Meditation | 7 |
| Concentration Curls | 8 |
| Half Push-Up | 8 |
| Band Trap Raise | 9 |
The negative points are comedy entries - squat rack is for squatting, not for curls. My Zombie survival RPG ZOINKS has a choose-your-own-adventure where you log that to represent ‘damage’. Similar for shake weight.
The rest is incredibly poor scoring activities that I did a very small number of times before progressing to better stuff. (incline push-up -> push-up -> decline push-up)
Looking at the calendar
JR_fito_data %>%
  mutate(week=week(actiondate), year=year(actiondate)) %>%
  group_by(week,year) %>%
  summarise(points=sum(points)) %>%
  ungroup() %>%
  ggplot(aes(x=week,y=year,fill=points)) + geom_tile() + ggthemes::theme_few() + scale_y_continuous(breaks = 2012:2019) + ggtitle("Fitocracy XP by week") + scale_fill_continuous(type = "viridis")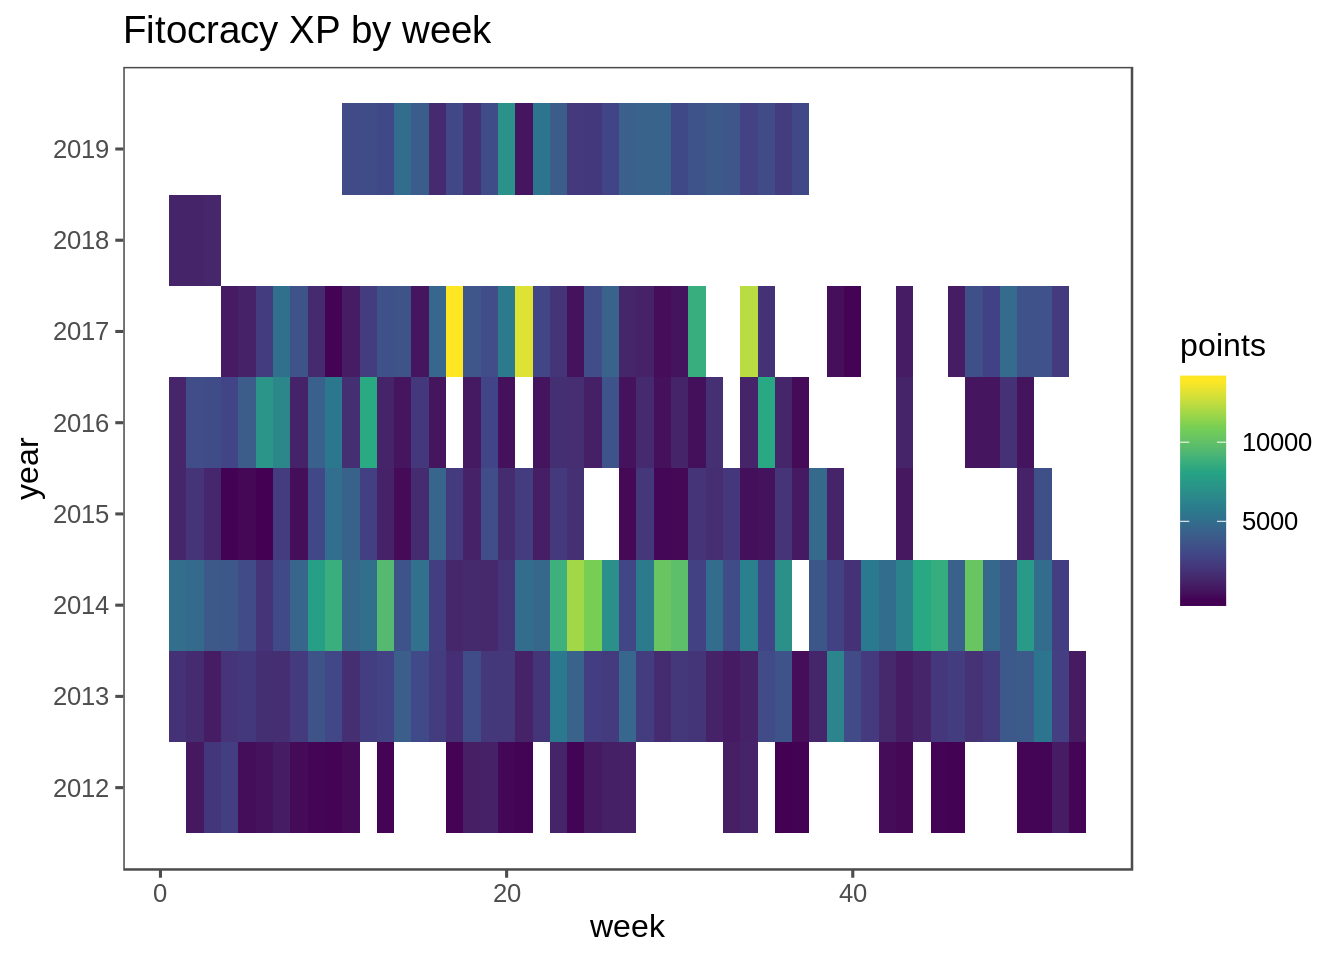
So apparently around this time of year I tend to stop working out. This is approximately the time of year I get a seasonal slump. The big gap around 2017-2019 relates to an episode of sciatica.
2012-2016 was my PhD, and I bought 3 years of uni gym. Initially for the swimming, then for the weights and rowing machine. Mostly I didn’t get my money’s worth from it. shrug.
Points aren’t really connected to how good a workout is. FRED 5 really, really likes it when we lift something near our personal best, 1ce. He begrudgingly gives extra points for cardio if we log a heart rate that is at least compatible with life. 6. So maybe looking at days where anything was logged is also useful.
JR_fito_data %>%
  select(actiondate) %>%
  distinct() %>%
  mutate(week=week(actiondate), year=year(actiondate)) %>%
  group_by(week,year) %>%
  summarise(n = n()) %>%
  ungroup() %>%
  ggplot(aes(x=week,y=year,fill=n)) + geom_tile() + ggthemes::theme_few() + scale_y_continuous(breaks = 2012:2019) + ggtitle("Number of workouts per week") + scale_fill_continuous(type = "viridis")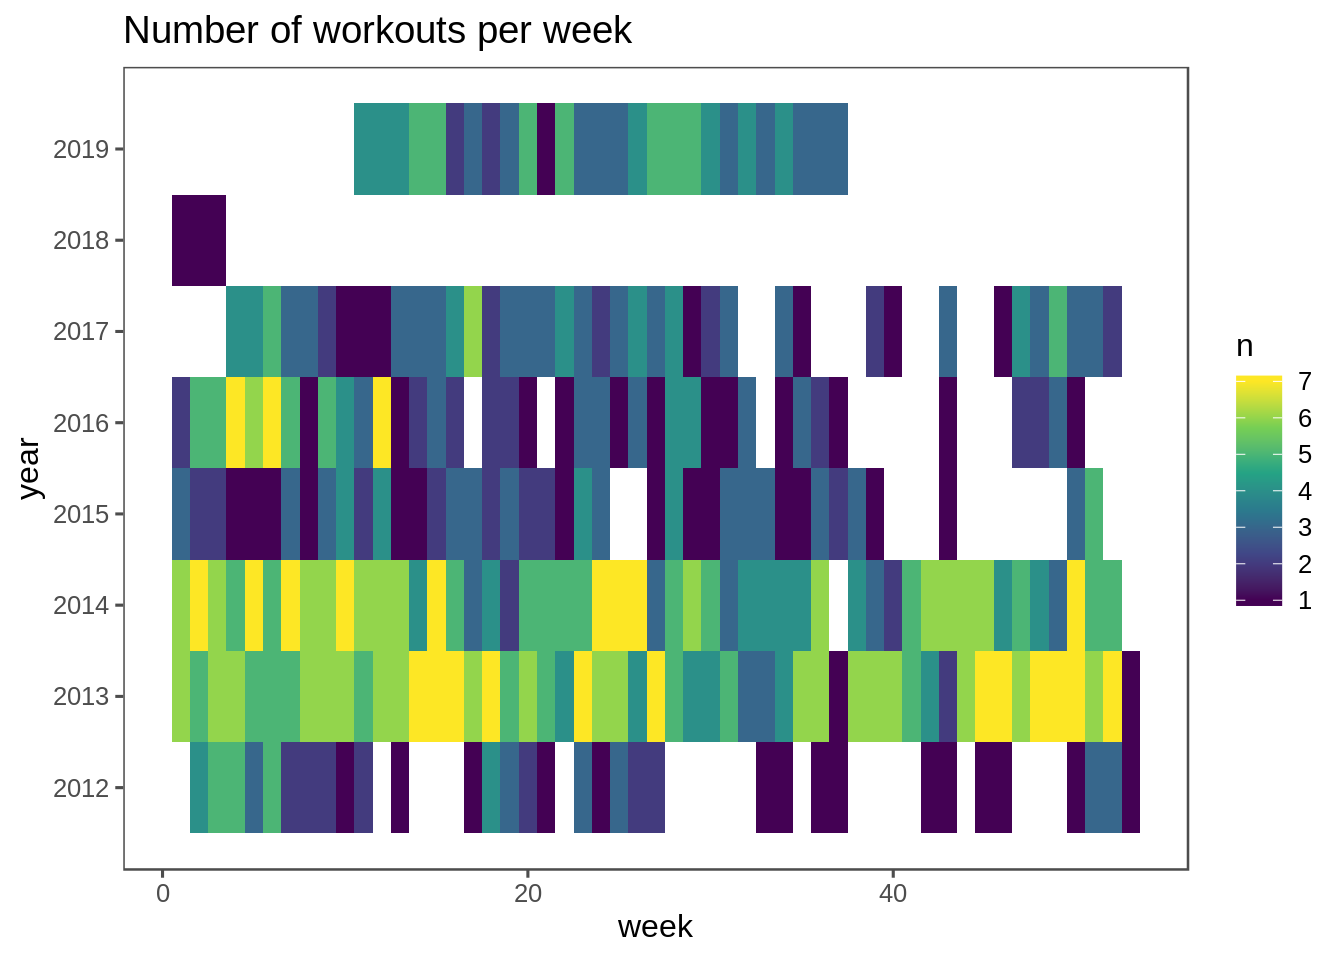
7 workouts/week is bad, bodies need rest. I’m happier with how this year looks than how 2013-14 looks.
I’m interested in Personal Records (PRs), and their progress over time. Fito isn’t great at graphing these in the site - the x-axis doesn’t really scale with time.
## A couple of helper functions.

extract_kg <- function(string){ # Plucks the kg measurement out of the dataset
  str_extract(string, "[0-9]+\\.?[0-9]* kg") %>%
    str_remove("kg") %>% #I know this could be rewritten as 1 regex, but I find this easier to read.
    as.numeric()
}

extract_PRs <- function(data, activity){
  data %>%
    filter(name==activity) %>%
    arrange(actiondate) %>%
    mutate(kg = extract_kg(string_metric)) %>%
    mutate(PR = cummax(kg)) %>% # which kg are bigger than any before?
    filter(kg==PR) # Keeping only entries that are PRs
}

plot_ly_PR <- function(data, activity){
  extract_PRs(data, activity) %>%
    plot_ly(x=~actiondate, y=~kg) %>%
      add_lines(line=list(shape="hv")) %>%
      layout(title=paste(activity, "PRs"))
}

plot_ly_PR(JR_fito_data, "Barbell Bench Press")
plot_ly_PR(JR_fito_data, "Standing Barbell Shoulder Press (OHP)")Oh, that long period from 2014-recently that I didn’t have access to a bench. This one illustrates a problem with user-submitted data - I believe that 2014 “Bench Press” was half-repped.
Anyhow, how do some other PR graphs look?
plot_ly_PR(JR_fito_data, "Barbell Deadlift")
plot_ly_PR(JR_fito_data, "Barbell Squat")With some different helpers, I can look at cumulative distance travelled.
## A couple of helper functions.

extract_km <- function(string){ # Plucks the kg measurement out of the dataset
  string <- str_extract(string, "[0-9]+\\.?[0-9]* k?m")
  meters <- !str_detect(string, "k")

  result <-  str_remove(string, "k?m") %>% #I know this could be rewritten as 1 regex, but I find this easier to read.
    as.numeric()

  if_else(meters, result / 1000, result)
}

extract_cumulative_distance <- function(data, activity){
  data %>%
    filter(name==activity) %>%
    arrange(actiondate) %>%
    mutate(km = extract_km(string_metric)) %>%
    mutate(cumulative_km = cumsum(km))
}

ggplot_dist <- function(data, activity){
  extract_cumulative_distance(data, activity) %>%
    ggplot(aes(x=actiondate,y=cumulative_km)) + geom_line() +
    ggthemes::theme_few()  +
    ggtitle(paste("Total Distance", activity))
}


ggplot_dist(JR_fito_data, "Cycling")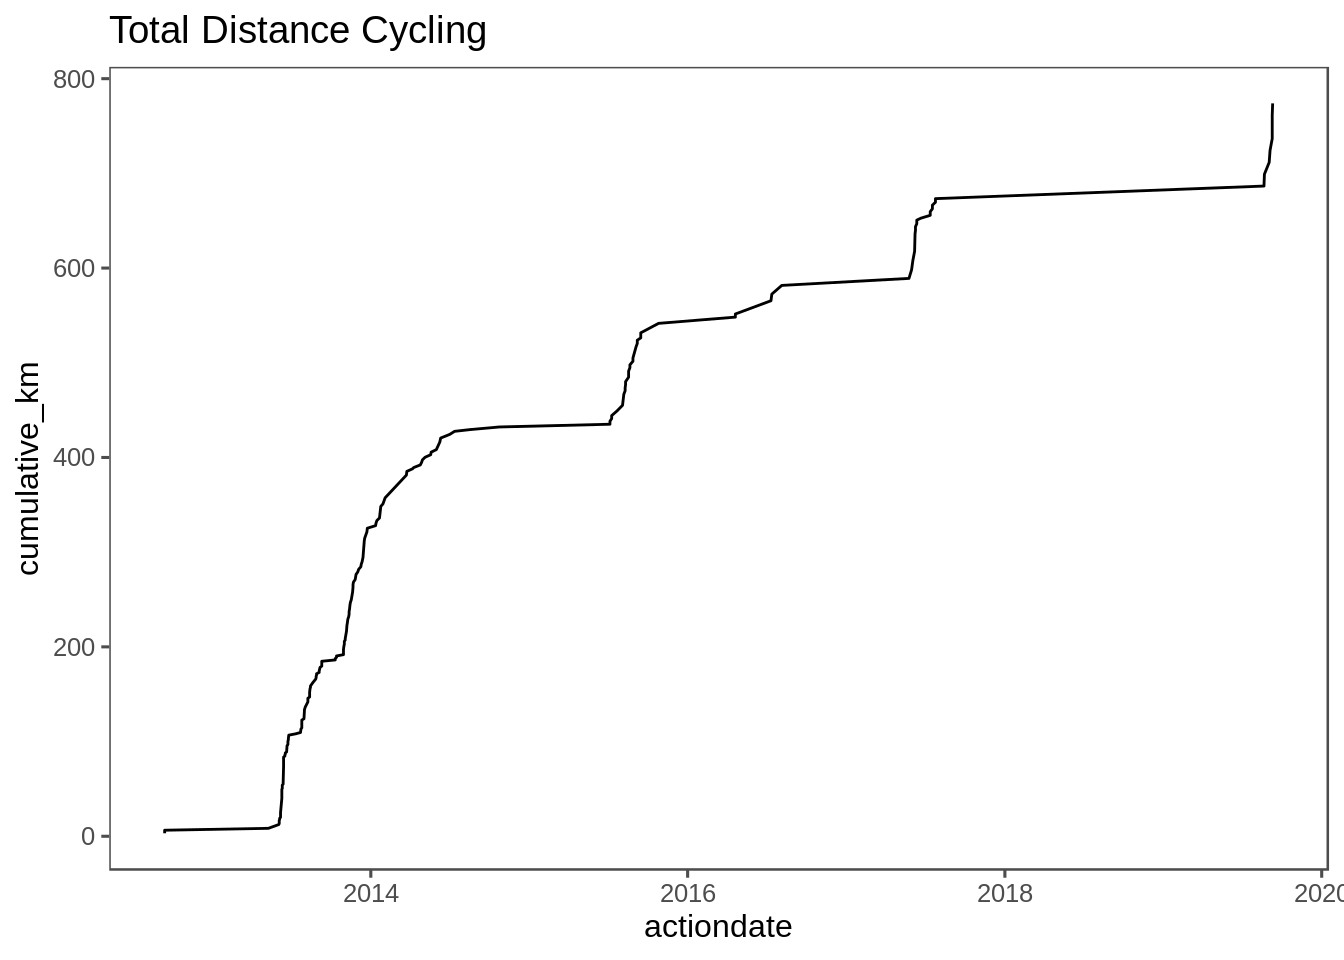
Running surprises me, given that I really dislike jogging, and have done the start of C25K a couple of times.
ggplot_dist(JR_fito_data, "Running")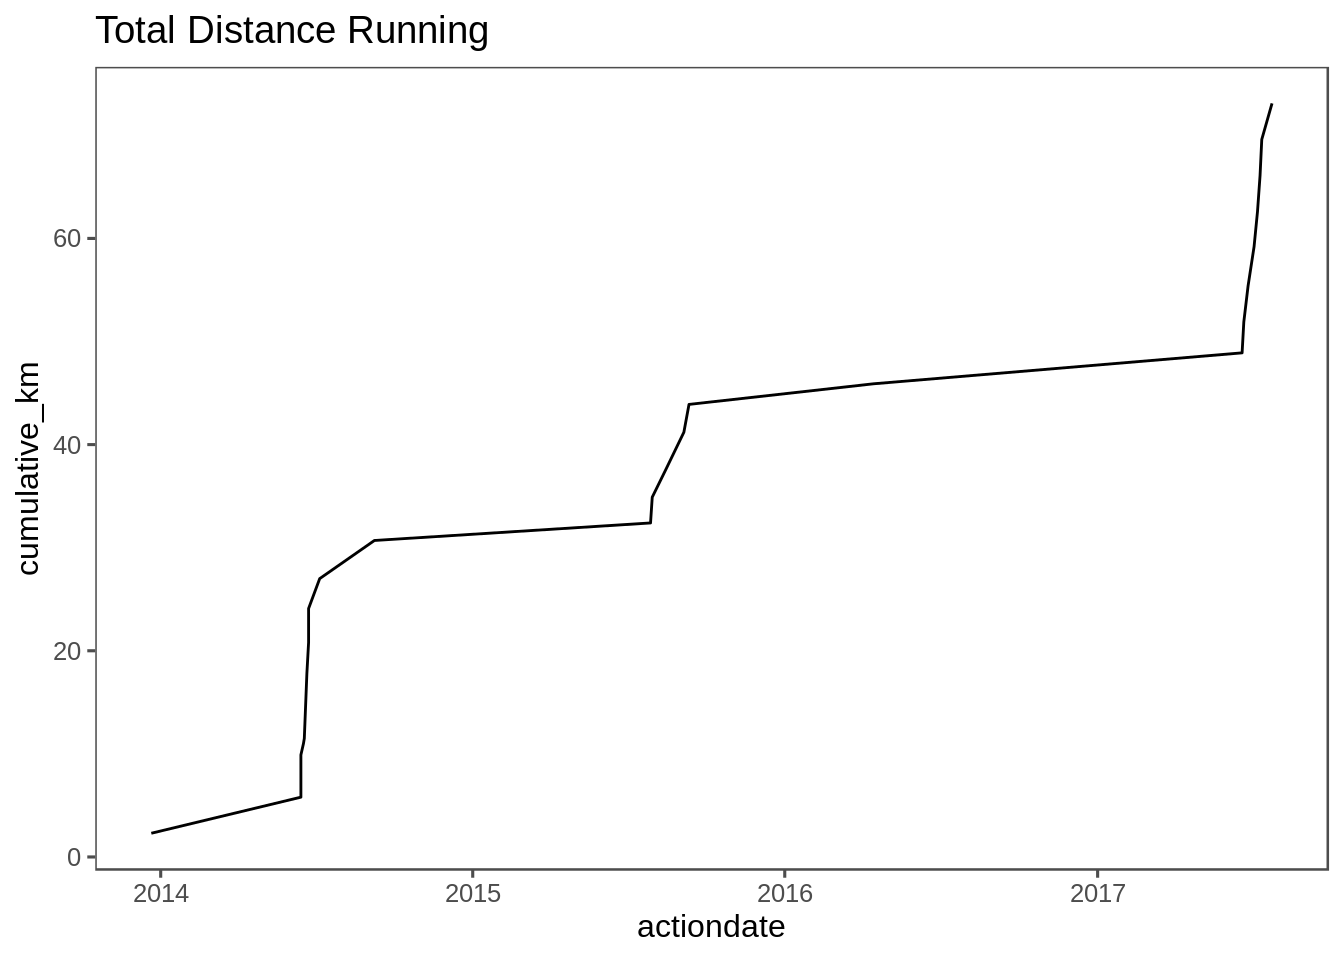
ggplot_dist(JR_fito_data, "Swimming")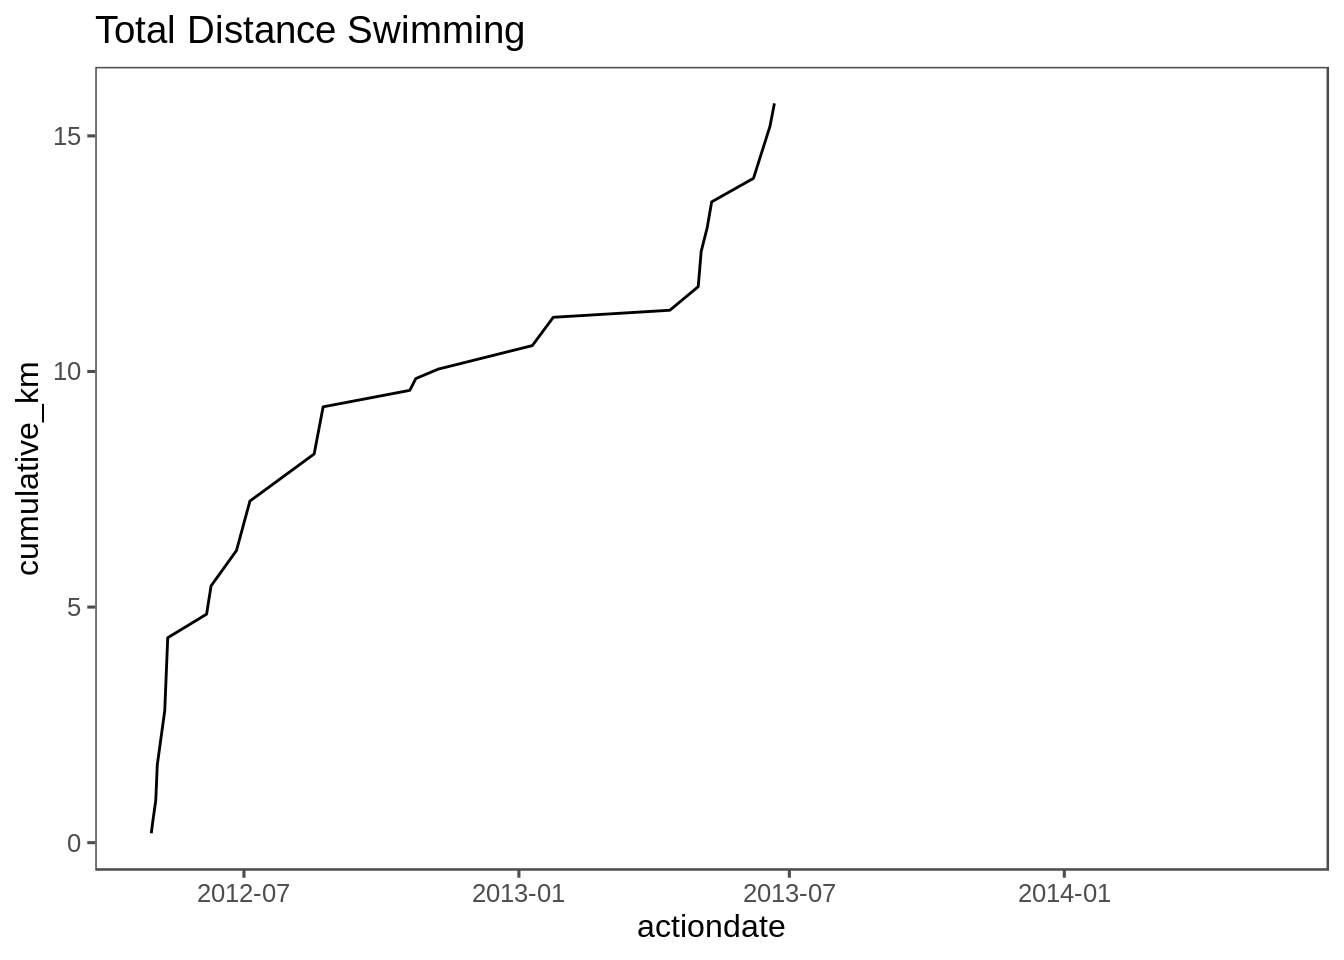
Yeah, I’ve not been swimming for a while.
Let’s grab the cycling total:
cycling_total_km <- extract_cumulative_distance(JR_fito_data, "Cycling") %>%
  top_n(1) %>%
  pull(cumulative_km)
Taking the dates of first and last cycling workouts logged (2012-09-13 and 2019-09-10), then on average, I’ve been travelling at 774 km per days(ymd("2019-09-10")-ymd("2012-09-13")) %>% str_extract("^[0-9]+") days, or about 300m/day, or 13m/hour. (Approximately a snail’s pace!)
Looking at a map, if I started from work-ish (Leeds City Centre), then how far would I have reached?
leaflet() %>%
  addTiles() %>%
addCircles(lat = 53.798250, lng = -1.532112, radius = 1000*cycling_total_km) 


So, a fast snail going in a straight line from Leeds-Norway, over 7 years, ignoring sleep and my inability to cycle on water! 7
Some of the ‘challenges’ we’ve had for fun on the site involve lifting as much volume as possible - defined by reps * weight. So 1 kg lifted 50 times is the same volume as 50 kg lifted 1ce. We have sometimes named these like “can you deadlift a blue whale?” (No, not all at once, but if you break it into enough pieces and give us enough time…)
Another helper function. At this point I wish I used package glue and saved the regex that plucks a decimal number. EDIT TO ADD: there was a typo in this which would have been easier to fix if I used glue in the first place.
volume <- function(string){
  kg <- str_extract(string, "[0-9]+\\.?[0-9]* kg") %>%
    str_remove("kg") %>%
    as.numeric()
  reps <- str_extract(string, "[0-9]+\\.?[0-9]* reps") %>%
    str_remove("reps") %>%
    as.numeric()

  kg * reps
}

JR_fito_data %>%
  mutate(volume = volume(string_metric)) %>%
  filter(!is.na(volume)) %>%
  group_by( name) %>%
  summarise(volume=sum(volume)) %>%
  ungroup() %>%
  top_n(10, volume) %>%
  arrange(desc(volume)) %>%
  mutate(volume = scales::comma(volume)) %>%
knitr::kable()| name | volume |
|---|---|
| Barbell Deadlift | 280,243 |
| Barbell Squat | 176,003 |
| Barbell Bench Press | 167,282 |
| Standing Barbell Shoulder Press (OHP) | 82,024 |
| Standing Military Press | 61,210 |
| Front Barbell Squat | 58,914 |
| Dumbbell Bench Press | 32,476 |
| Pendlay Row | 32,116 |
| Dumbbell Deadlift | 27,700 |
| Dumbbell Bicep Curl | 24,002 |
Analogous to the total distance cycled would be total kg-reps lifted over time:
volume_graph <- function(data, activity){
  data %>%
    filter(name==activity) %>%
    mutate(volume = volume(string_metric)) %>%
    filter(!is.na(volume)) %>%
    arrange(actiondate) %>%
    mutate(volume=cumsum(volume)) %>%
    ggplot(aes(x=actiondate,y=volume)) + geom_line() + ggthemes::theme_few() +
      ggtitle(str_c("Total Volume Over Time: ", activity)) + ylab("Volume (kg-reps)") + scale_y_continuous(labels = scales::comma)
}

volume_graph(JR_fito_data, "Barbell Deadlift")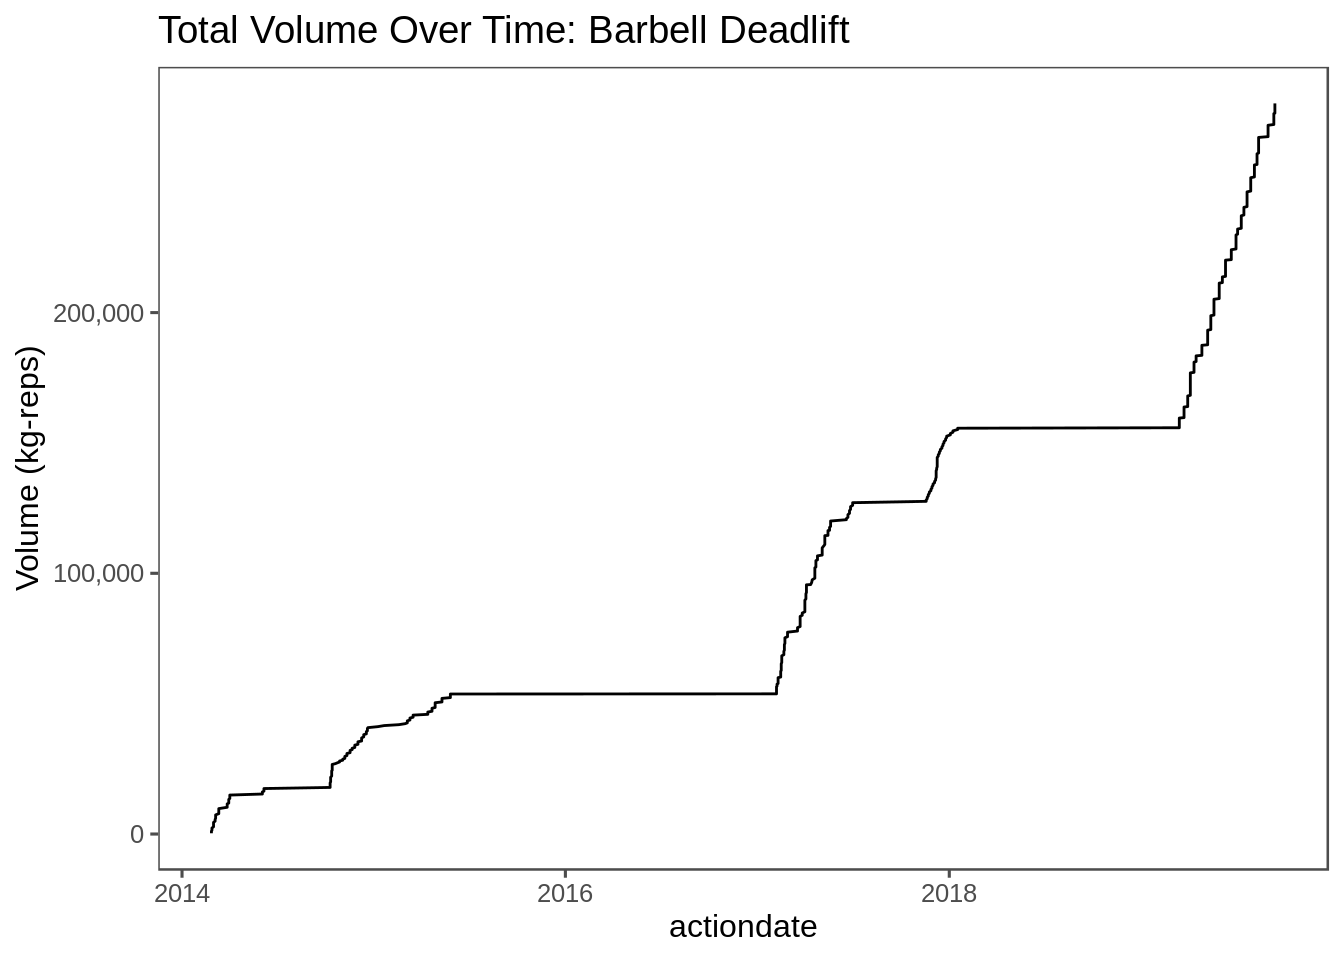
volume_graph(JR_fito_data, "Barbell Squat")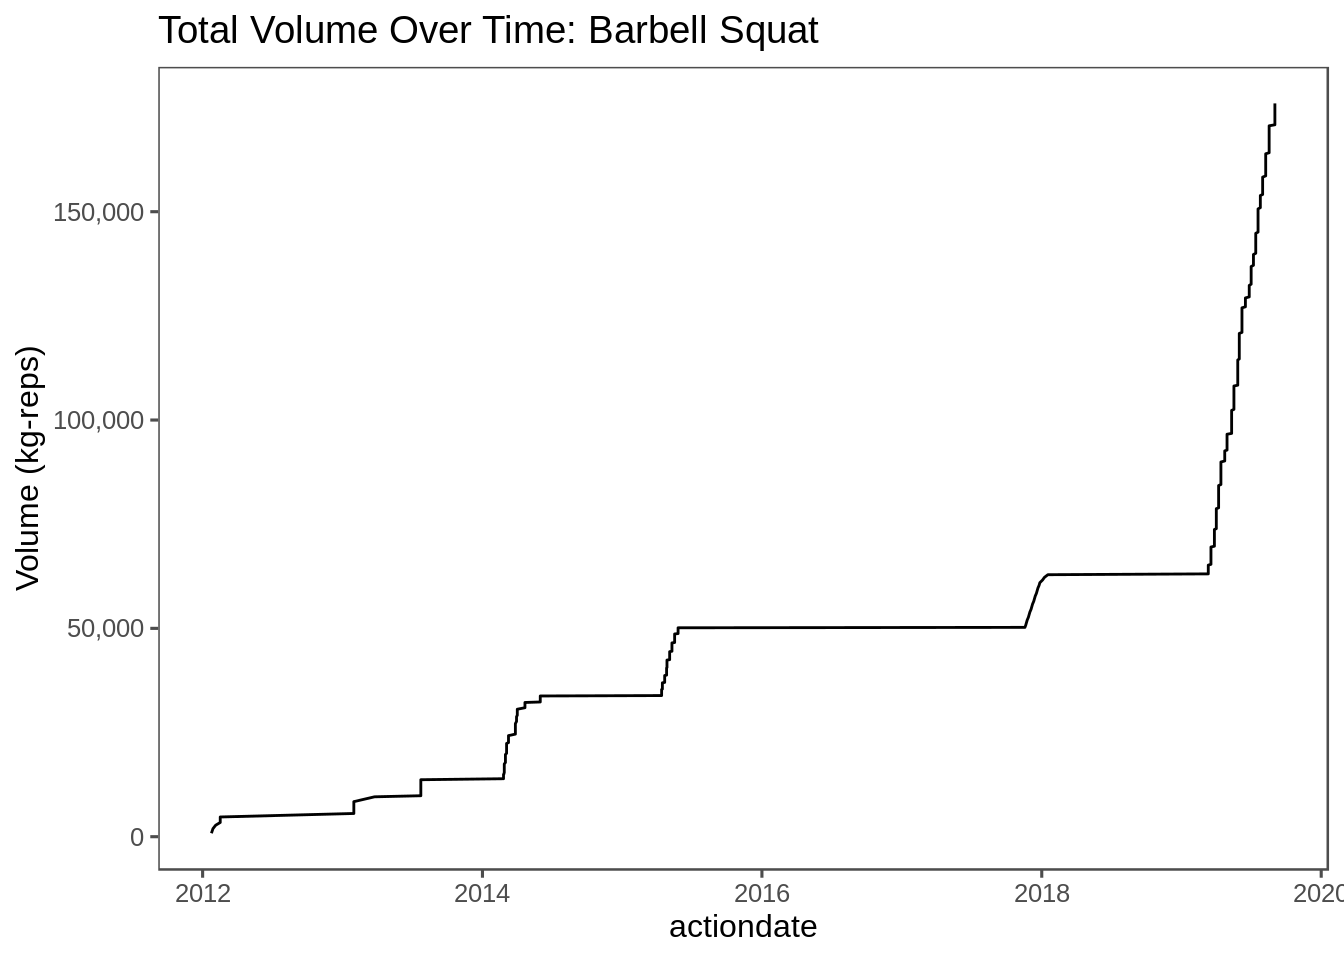
volume_graph(JR_fito_data, "Ring Pull-Up")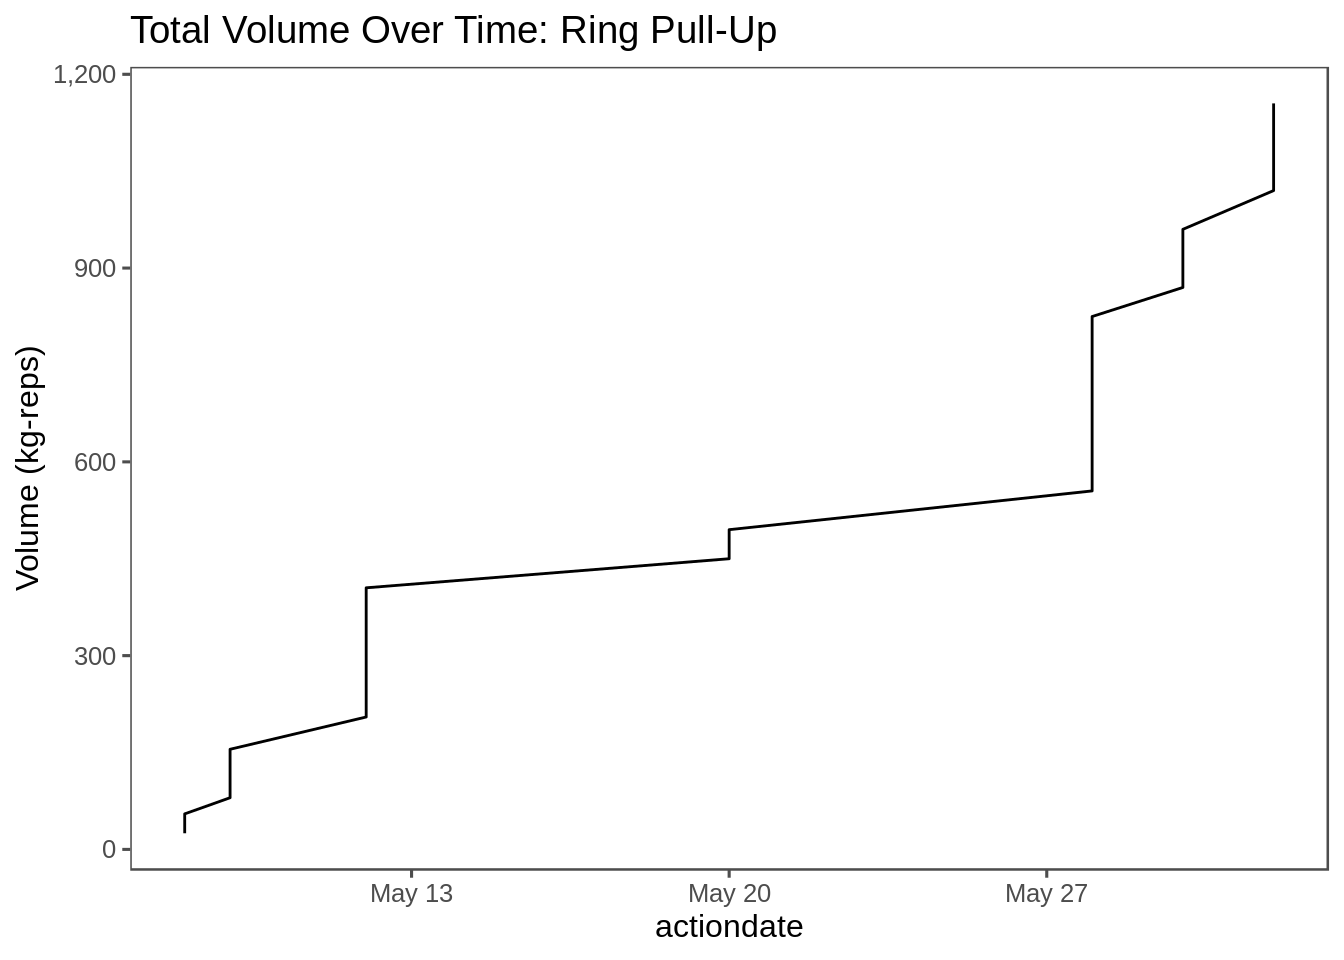
The units for volume is really kilogram-reps. Or we can drop a comma and look at tonne-reps. 272 tonnes is approximately the mass of a blue whale 8, so since 2014 I’ve done lifts that add up to a whale. Cut into many, many pieces, and probably very rotten.
A totally useless graph of the volume of everything, but it’s sometimes funny throwing way too many factors at a graph. I’ve removed the legend, because otherwise the whole graph was legend!
cumulative_volume <- JR_fito_data %>%
  mutate(volume = volume(string_metric)) %>%
  filter(!is.na(volume)) %>%
  mutate(actiondate=floor_date(actiondate, "week"))


missing_values <- cross_df(list(
  name=unique(cumulative_volume$name),
  actiondate=as.character(unique(cumulative_volume$actiondate))
)) %>%
  mutate(actiondate=ymd(actiondate)) %>%
  anti_join(cumulative_volume) %>%
  mutate(volume=0)

bind_rows(cumulative_volume, missing_values) %>%
  group_by(name, actiondate) %>%
  summarise(volume = sum(volume)) %>%
  arrange(actiondate) %>%
  mutate(volume = cumsum(volume)) %>%
  ungroup() %>%
  arrange(volume) %>%
  mutate(name=as_factor(name)) %>%
  ggplot(aes(x=actiondate, y=volume, fill=name)) + geom_area() + ggthemes::theme_few() + theme(legend.position = "none") + scale_y_continuous(labels = scales::comma) +
  ggtitle("Cumulative volume, activity highlighted") + scale_fill_viridis_d()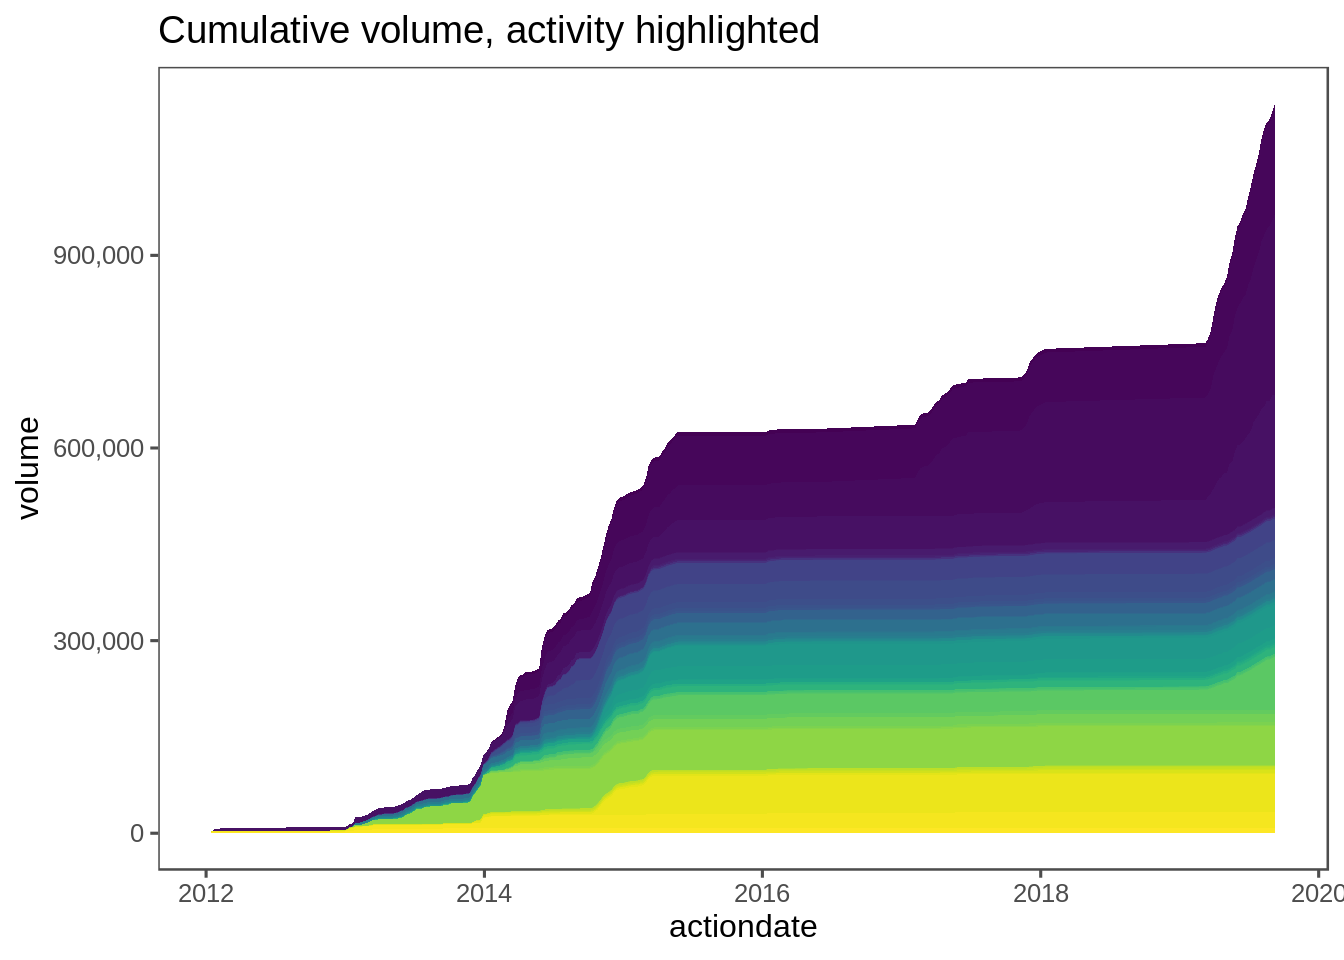
I’m interested in that calendar graph again.
cumulative_volume %>%
  group_by(actiondate) %>%
  summarise(volume=sum(volume)) %>%
  mutate(week=week(actiondate), year=year(actiondate)) %>%
  ggplot(aes(x=week,y=year,fill=volume)) + geom_tile() + ggthemes::theme_few() + scale_y_continuous(breaks = 2012:2019) + ggtitle("Volume by week") + scale_fill_continuous(type = "viridis")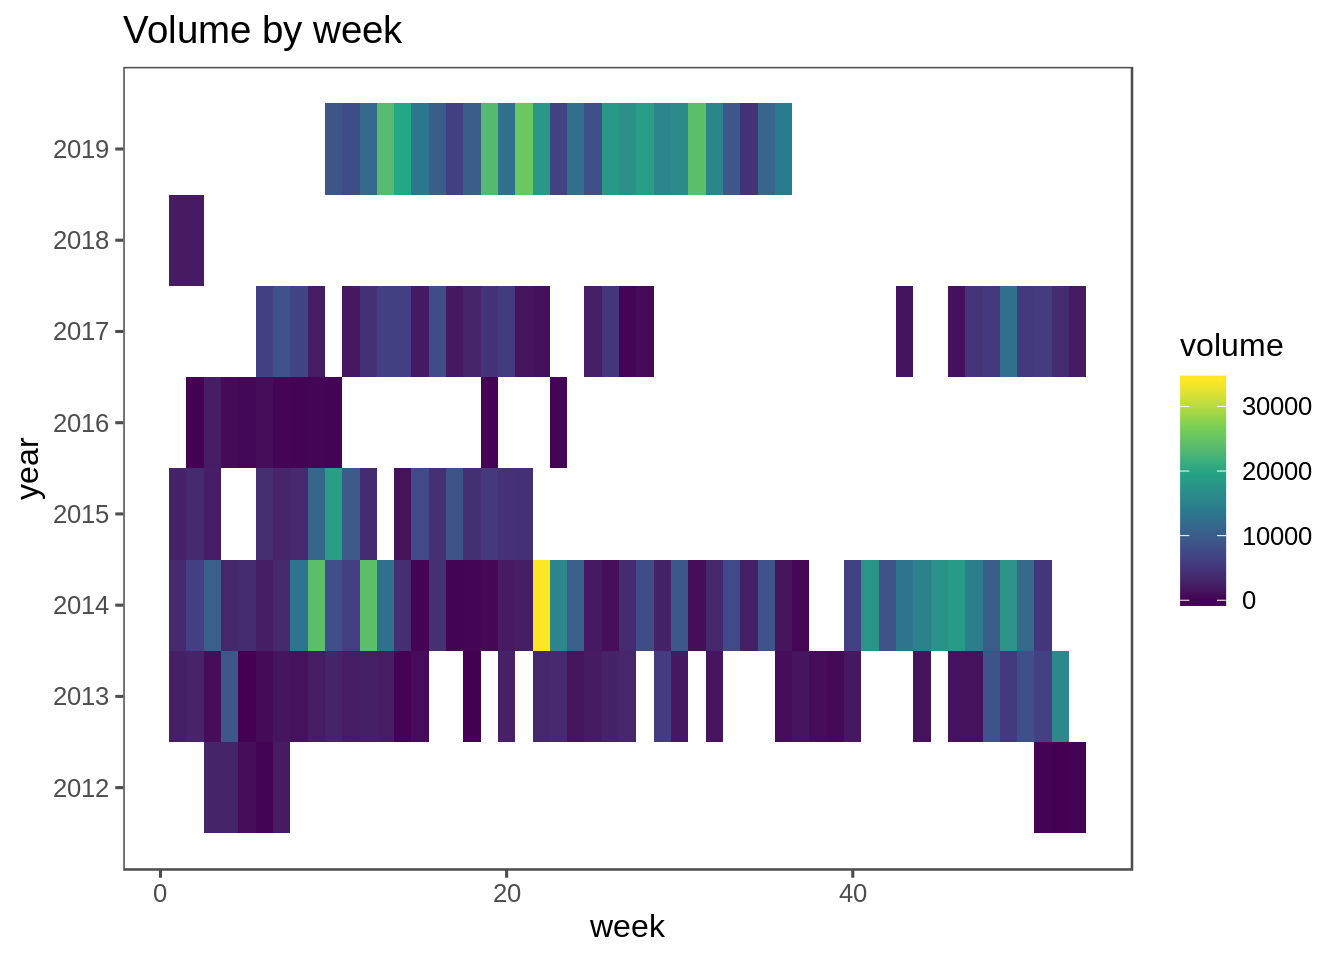
What the heck happened that week in 2014? I’ve looked at the data. A lot of dummbell stuff, as well as the biggest lifts I did for a long time. The current stretch I’m in is certainly more consistent than any previous one!
There’s a few cases where this is flat out wrong - the time I was doing assisted pull ups will be logging the assisted weight as volume. But I could spend all day chasing increasingly rare edge cases.
Live (Action) Role Play Games. Think Dungeons & Dragons, but in costume, and with foam weapons instead of dice. Or improv theatre, without an audience. Or cross-country pantomime.↩
This is my affiliate link. I’ll get 1 month of ‘hero’ if 10 people sign up. I don’t value ‘hero’, I’m just curious if anyone follows the link.↩
Y-M-D makes sense. We write one hundred and twenty three as 123, not 321.↩
Fito calls them ‘points’ now, but it’ll always be XP to me.↩
Their mascot who appears when submitting your workout log. We blame this robot for most weird stuff on the site.↩
Note to self, do something with the epic amounts of data your Mii Band has been generating.↩
Deploy the decoy snail.↩
Cue the QI klaxon.↩