The story so far
In part 1 we saw how you can estimate difficult probabilities with a large number of simulations. Every time I updated that post my poor home desktop took 10 mins to run the simulation. And it still wasn’t good enough. Also, it doesn’t scale. 10 minutes times 100 ages times 2 sexes = NO.
Probability Trees
It is time to think smarter. When in doubt in probability with a small number of outcomes, I like to draw probability trees. In any given year, your author will survive, or he will die (absurd 3rd options welcomed in the comments). For any given year, ONS have provided the probability of dying, \(p\), the only other option is surviving, so must be \(1-p\).
So the first few levels of my probability tree look like:
Age30 <- Node$new("Age 30")
  dead_at_30 <- Age30$AddChild("Die")
  Age31 <- Age30$AddChild("Age 31")
    dead_at_31 <- Age31$AddChild("Die")
    Age32 <- Age31$AddChild("Age 32")
plot(Age30)
I see a pattern! My probability of dying at exactly a given age is the case where I follow the survive path until that age, then I follow the branch where I die. Following multiple paths is just multiplication. And the chance that I survive at least to a certain age is the product of all the edges where I survive up to that age.
Examples. I need examples.
mortality_tables <- read_csv(here("static","data","Open Government Licence","uk mortality 14-16.csv"))

James_example <- mortality_tables %>%
  select(-Females) %>%
  filter(Age>=30) %>%
  rename(p_death = Males) %>%
  mutate(p_survive = 1-p_death) %>%
  mutate(survive_at_least = cumprod(p_survive)) %>%
  mutate(die_at_exactly = survive_at_least * p_death)

ggplot(James_example) + aes(x=Age, y=survive_at_least) + geom_col()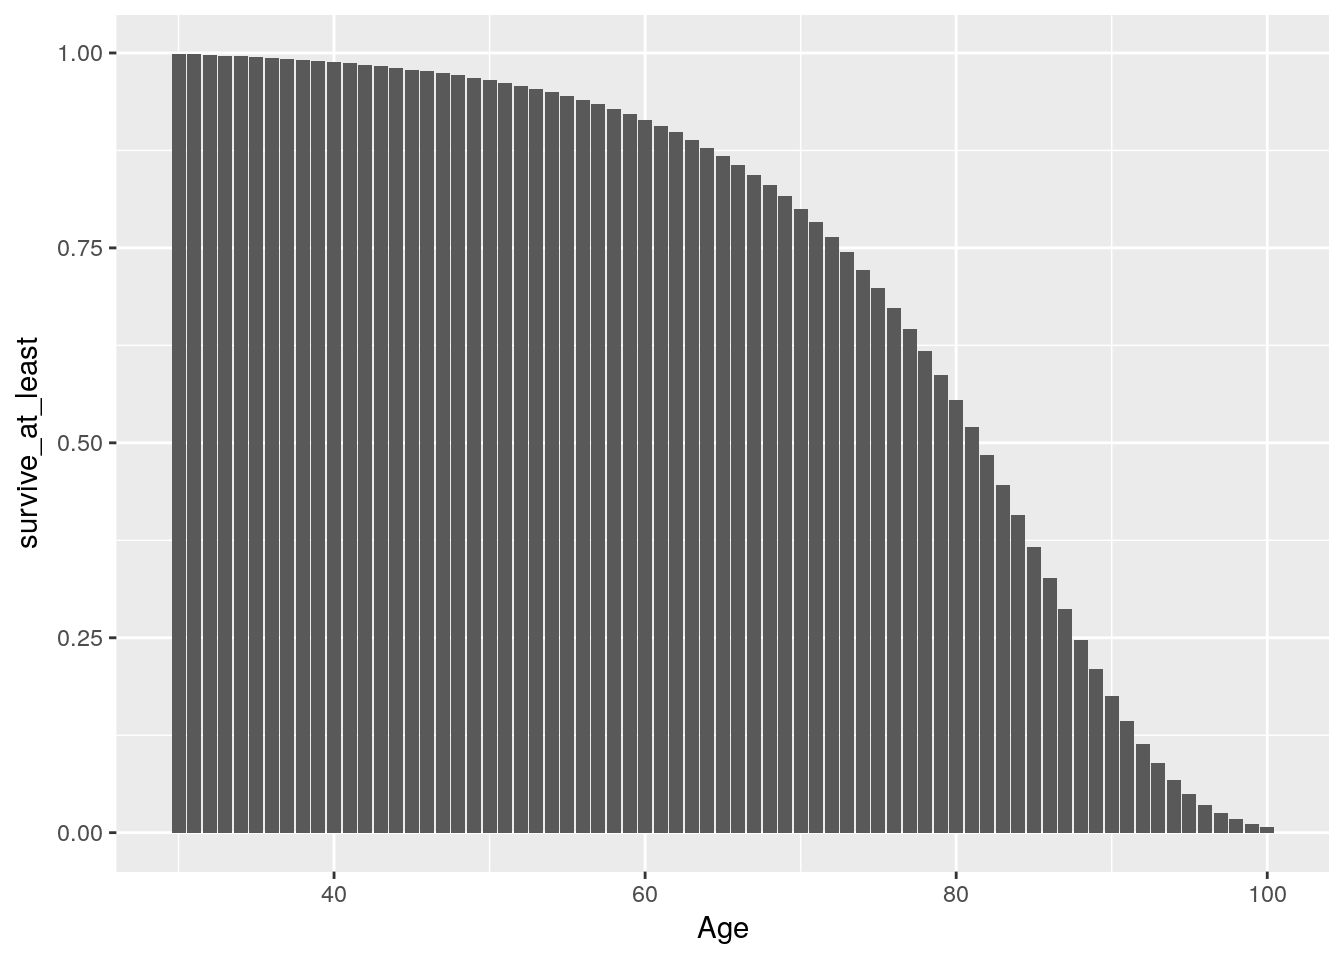
ggplot(James_example) + aes(x=Age, y=die_at_exactly) + geom_col()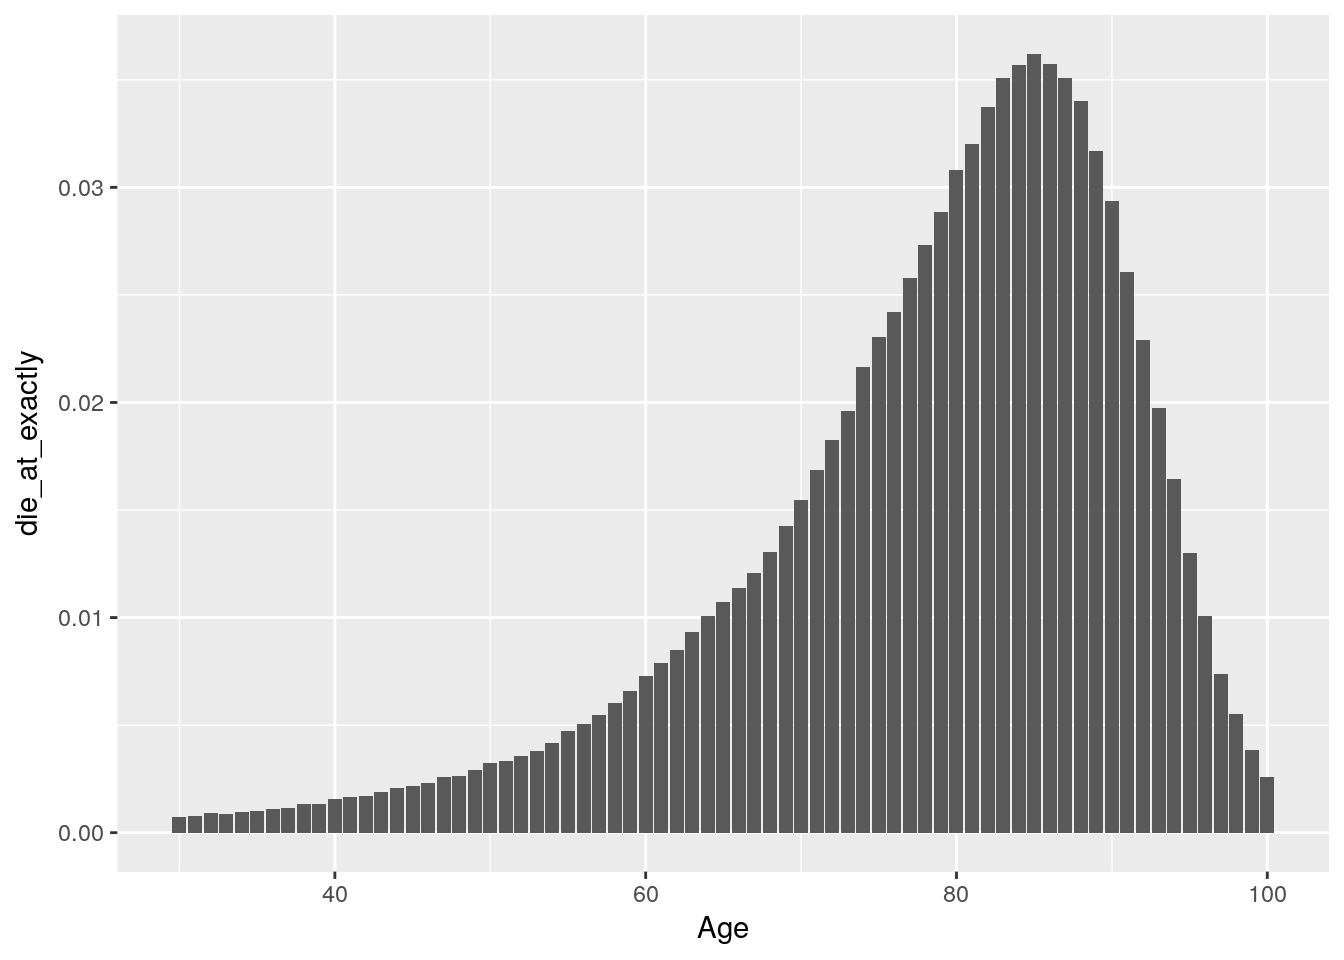
I probably should do a facet wrap.
Anyway, in far less time than my Monte Carlo simulation I have the data I want for the questions I asked last time:
- How long do I have left?
Can’t answer that exactly, but we have a probability distribution above. Could get hit by a bus tomorrow, could live to see the discovery of immortality.
- Will I ever pay off my student loans?
Insufficient data. But the probability of surviving to the point where they get written off. Which is apparently 25 years from the first April after graduation for my cohort, or age \(25+25=50\). Selecting exactly the right entry is 0.964963. So unless I botch on a d20, I’m living long enough to pay off my student loans. A project for a future date is reasonable forecasting actual payments vs interest.
- Do I get to see Halley’s Comet?
Astronomy was my “in” to science. Even in the city you can look upwards and learn constellations from a young age. We expect the comet next on 2061, when I will be 73. This time the probability is 0.7442964. So basically this time I need to not botch on a d4. Then I will have lived through the dates of 3 of the 4 Space Odyssey books. (And let’s face it, we’ll need some form of immortality for me to live to 3001.) For reference, the comet’s last appearance was 2 years before I was born.
- Living to retirement?
I have a pension I’m paying into. What are the current chances of me living to collect? Currently state pension age is 68. (I’m not forecasting what it will be in a few years. But everyone knows that it goes up as life expectancy goes up.) This is 0.8306545. Approximately 17 out of 20, or a 4 and above on a d20. Definitely likely enough that I’m not opting out of my pension.
QA
Does my 50% mortality calculation match that of ONS? My 50% mortality is 81, which matches ONS’s 50 remaining years. Except they have decimals. I want decimals.
There are 2 ways I can get to the decimal answer for remaining life:
- make reasonable assumptions, model them, and see which one matches the ONS method.
- use the contact email on the data source.
- read the documentation.
I’ve not decided what to do yet. (ED: I’ve already started reading the documentation.)
Interestingly, the median life expectancy does not match the modal life expectancy. The peak of that graph occurs somewhere in 85. I don’t want to deal with the mean right now, partially because this graph cuts off at age 100.
Generalising
This is definitely part 3. I have ideas that need fleshing out for displaying the above 2 graphs for any age/sex. Especially since I need to do it in Javascript instead of Shiny. I either need a htmlwidget that already handles this, or I need to generate 404 images and have some Javascript load the correct one. And potentially something in the DT package for selecting appropriate subsets of a tibble.
I also need to talk about conditional probability properly.