With thanks to this tutorial on network analysis in R I’ve not followed all the suggestions, but it’s been a good springboard.
Intro
Looks like I’m going to sometimes use tidygraph, sometimes go down one level and go to igraph as necessary.
Graph Theory (as I was taught it), or Network Theory (which makes googling it easier because there’s something else called a graph) is a nice bit of Discrete Maths. It opens with Euler trying to walk across all these bridges exactly once:
tribble(
  ~from, ~to,
  "a", "b",
  "a", "b",
  "a", "c",
  "a", "c",
  "a", "d",
  "b", "d",
  "c", "d"
) %>%
as_tbl_graph(directed=FALSE) %>%
  plot()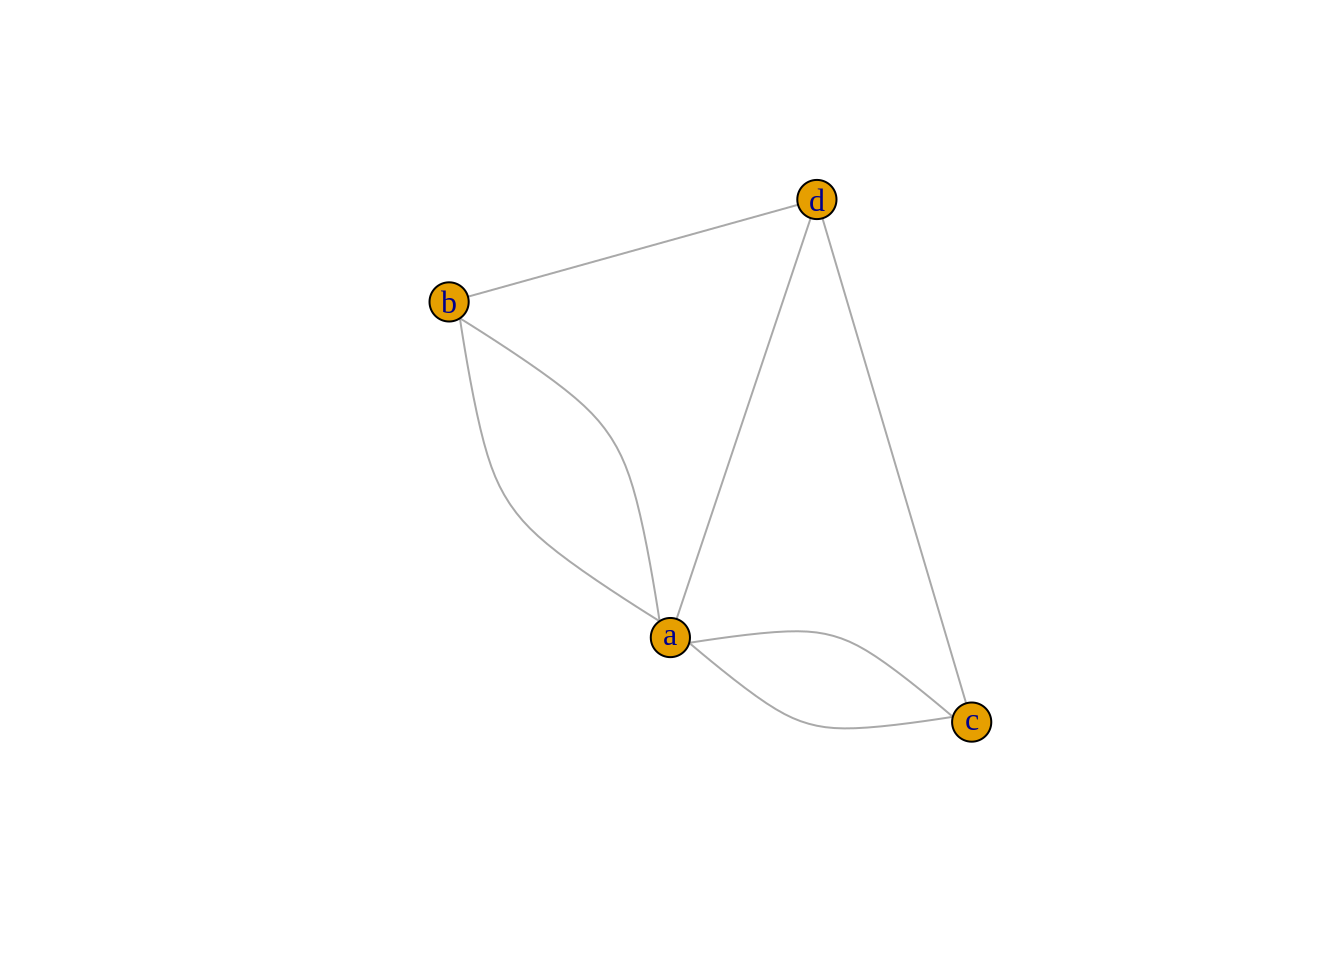
Which finds its way into general usage as “draw that figure without taking your pen off the paper”. (Or punching a hole in the paper, or folding the paper over to extend…)
That one can’t be done. Neither can these:
make_full_bipartite_graph(3,3) %>%
  plot(layout=layout_as_bipartite)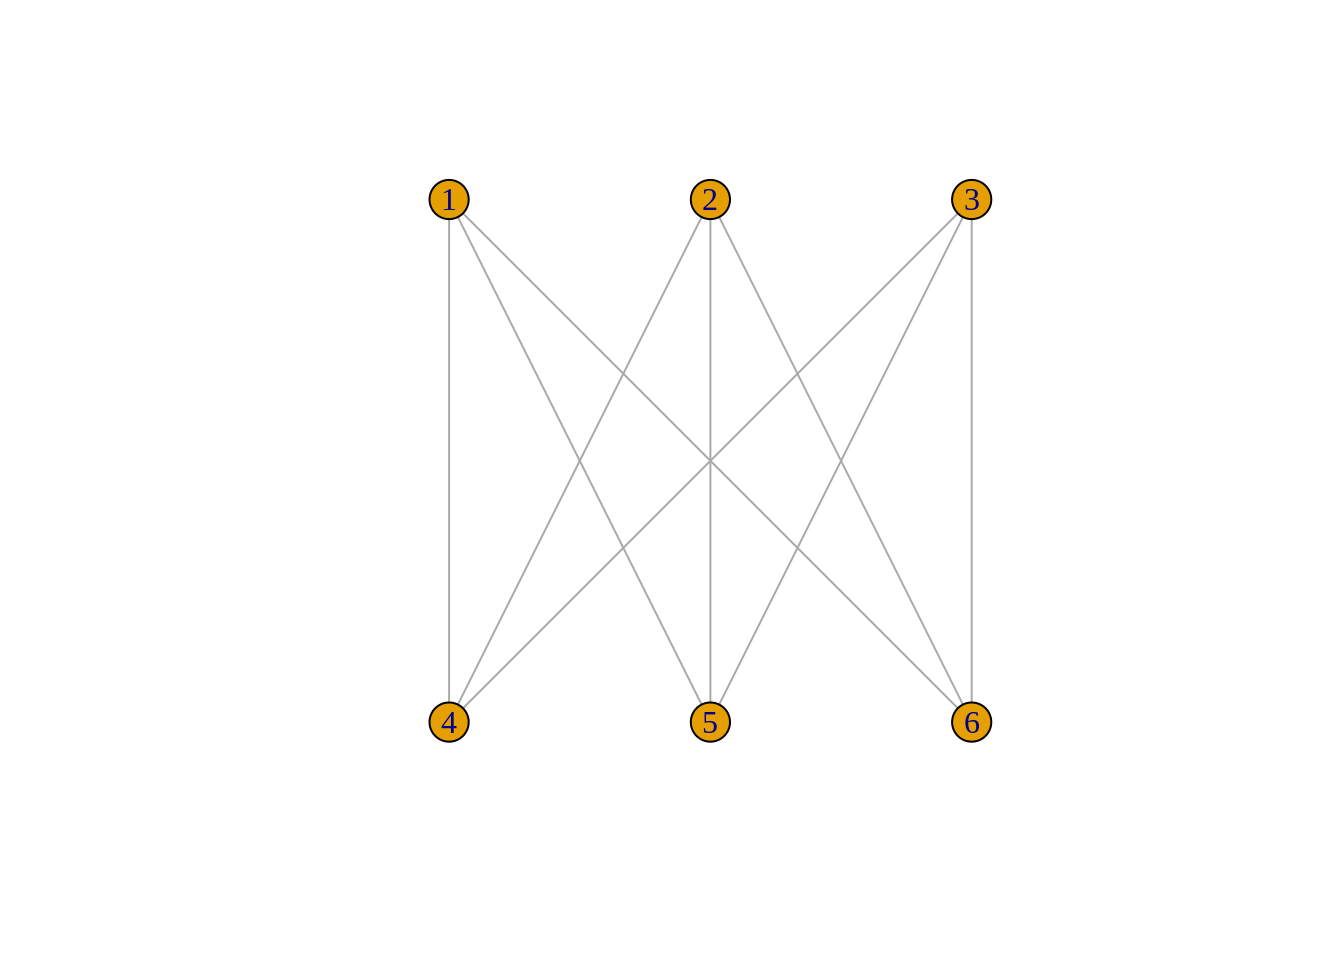
make_full_graph(5) %>%
  plot()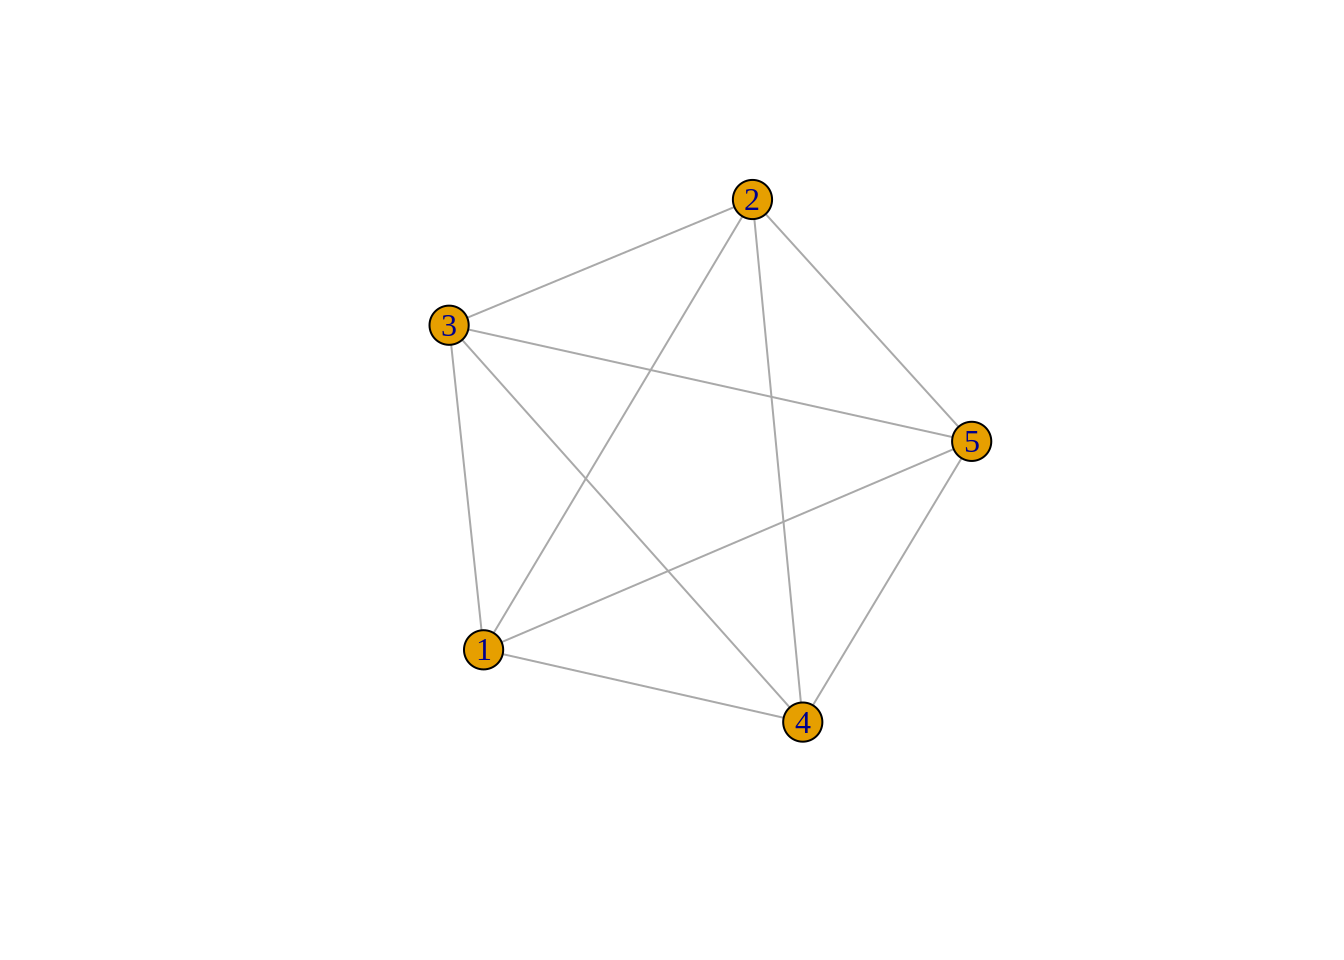
Rock-Paper-Scissors-Psychic-Dark
All you need for a network is some objects and some relationship between them. If your relationship is “wins against” then rock-paper-scissors looks like:
tribble(
  ~from, ~to,
  "rock", "scissors",
  "scissors", "paper",
  "paper", "rock"
) %>%
  as_tbl_graph() %>%
  plot(vertex.shape="none")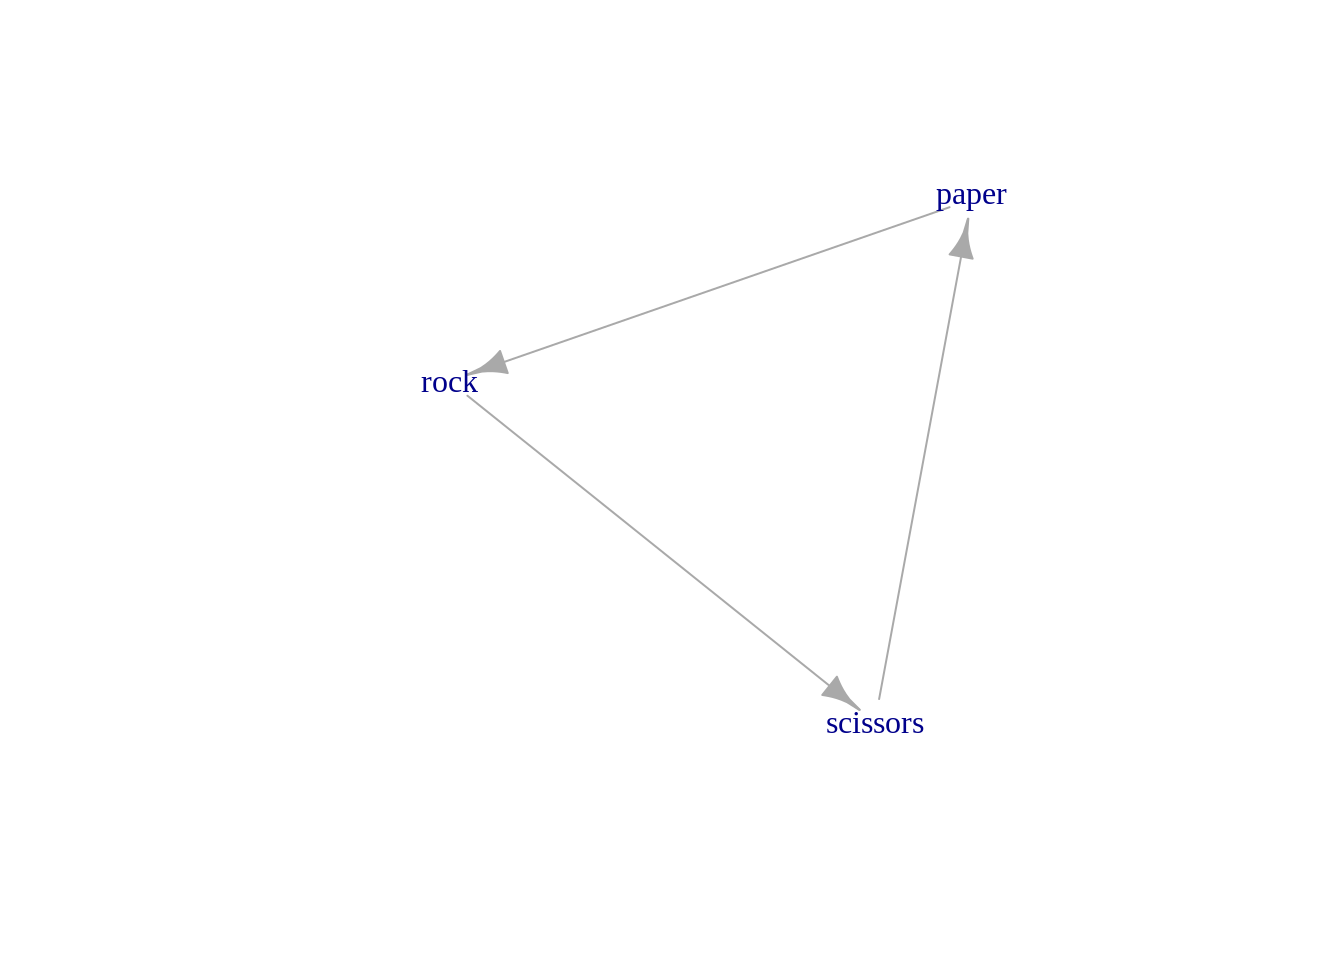
Which shows the symmetry and ‘fairness’ in RPS quite nicely. Rock-paper-scissors-lizard-Spock and a multitude of more have similar shapes.
Pokemon has a similar thing, but not the same symmetries. I’m going to focus on Pokemon-Go, because that’s what I’m currently playing.
Pokemon has normal damage, super-effective, not very effective, and immune. Go has implemented “immune” as not very effective 2ce, rather than actual immunity. The below shows these with different coloured arrows.
pogo_type_effectiveness <- read_csv(here("static", "data", "PoGo", "type_effectiveness.csv")) %>%
  rename(from=X1) %>%
  gather(to, value, -from)

pogo_graph <- pogo_type_effectiveness %>%
  filter(!is.na(value)) %>%
  mutate(game_text = case_when(
    value<0.6 ~ "Immune",
    value < 1 ~ "Not very effective",
    TRUE ~ "Super-effective"
  )) %>%
  mutate(color = case_when(
    value<0.6 ~ "maroon",
    value < 1 ~ "red",
    TRUE ~ "green"
  )) %>%
  as_tbl_graph()

plot(pogo_graph, edge.color = E(pogo_graph)$color, layout=layout_in_circle, vertex.shape = "none", edge.arrow.size=0.3, edge.curved=0.1)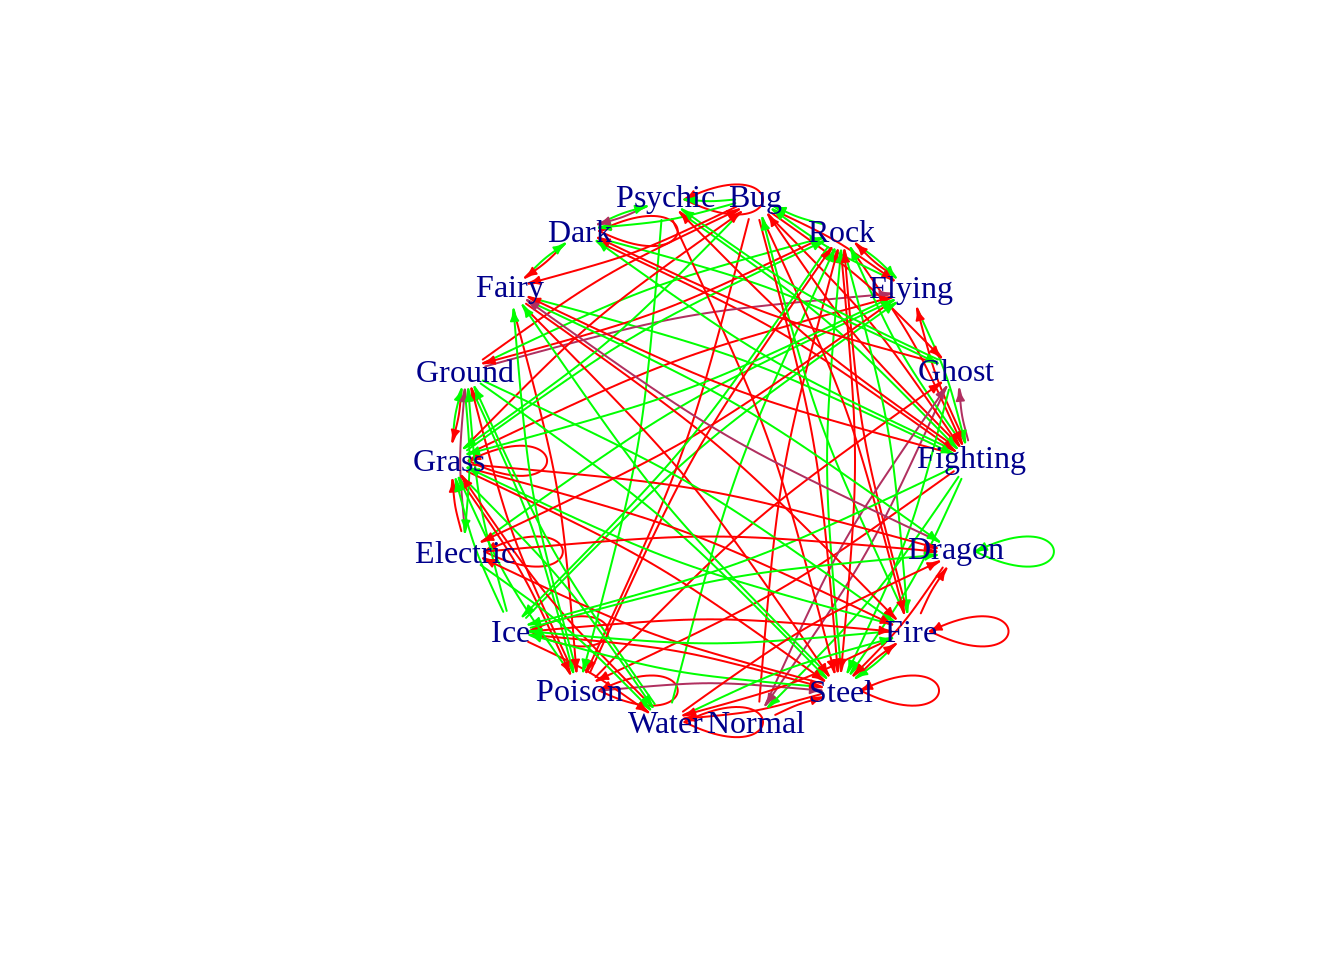
This is absolutely a hairball graph!
Throwing tidygraph at it, I can filter out just the super effective, or the not very effective:
pogo_graph %>%
  activate(edges) %>%
  filter(color=="green") %>%
  plot(edge.color="green", layout=layout_in_circle, vertex.shape = "none", edge.arrow.size=0.3, edge.curved=0.1)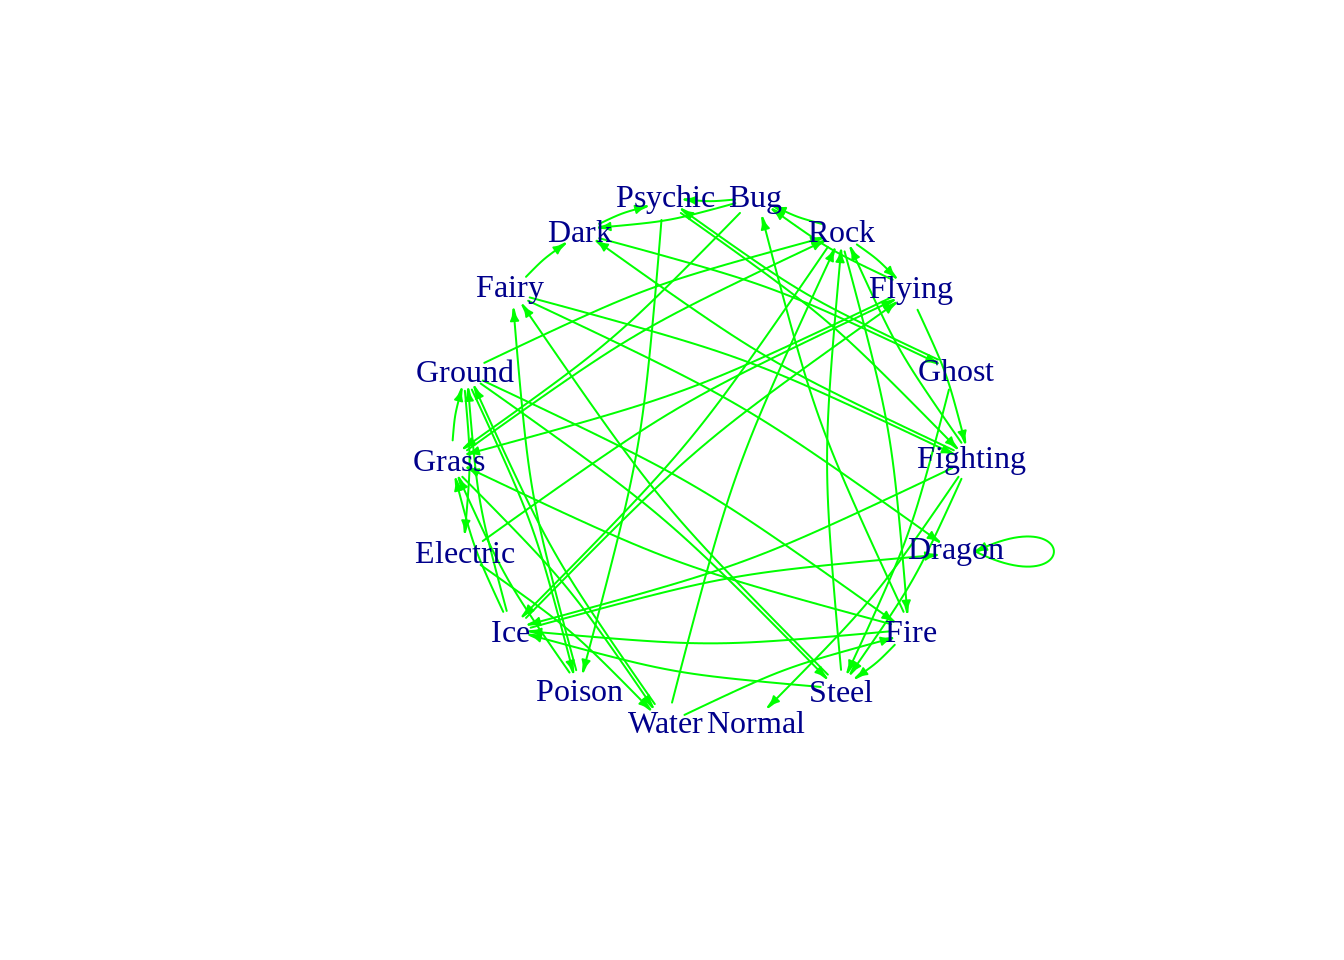
pogo_graph %>%
  activate(edges) %>%
  filter(color=="red") %>%
  plot(edge.color="red", layout=layout_in_circle, vertex.shape = "none", edge.arrow.size=0.3, edge.curved=0.1)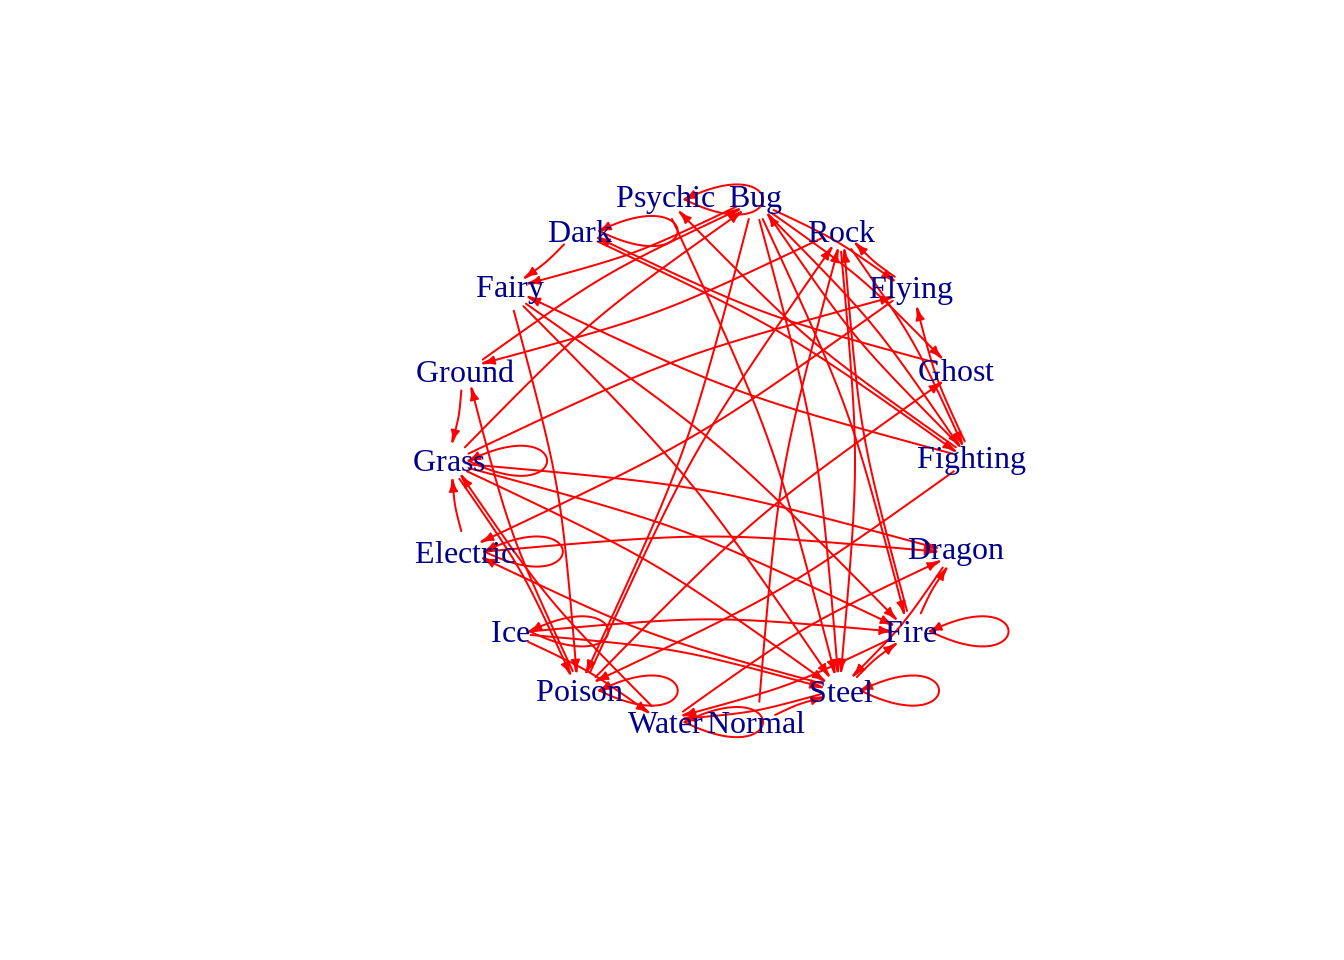
For the temptest cup
pogo_graph %>%
  activate(nodes) %>%
  filter(name %in% c("Electric", "Ice", "Flying", "Ground")) %>%
  plot(layout=layout_in_circle, vertex.shape = "none", edge.arrow.size=0.3, edge.curved=0.1)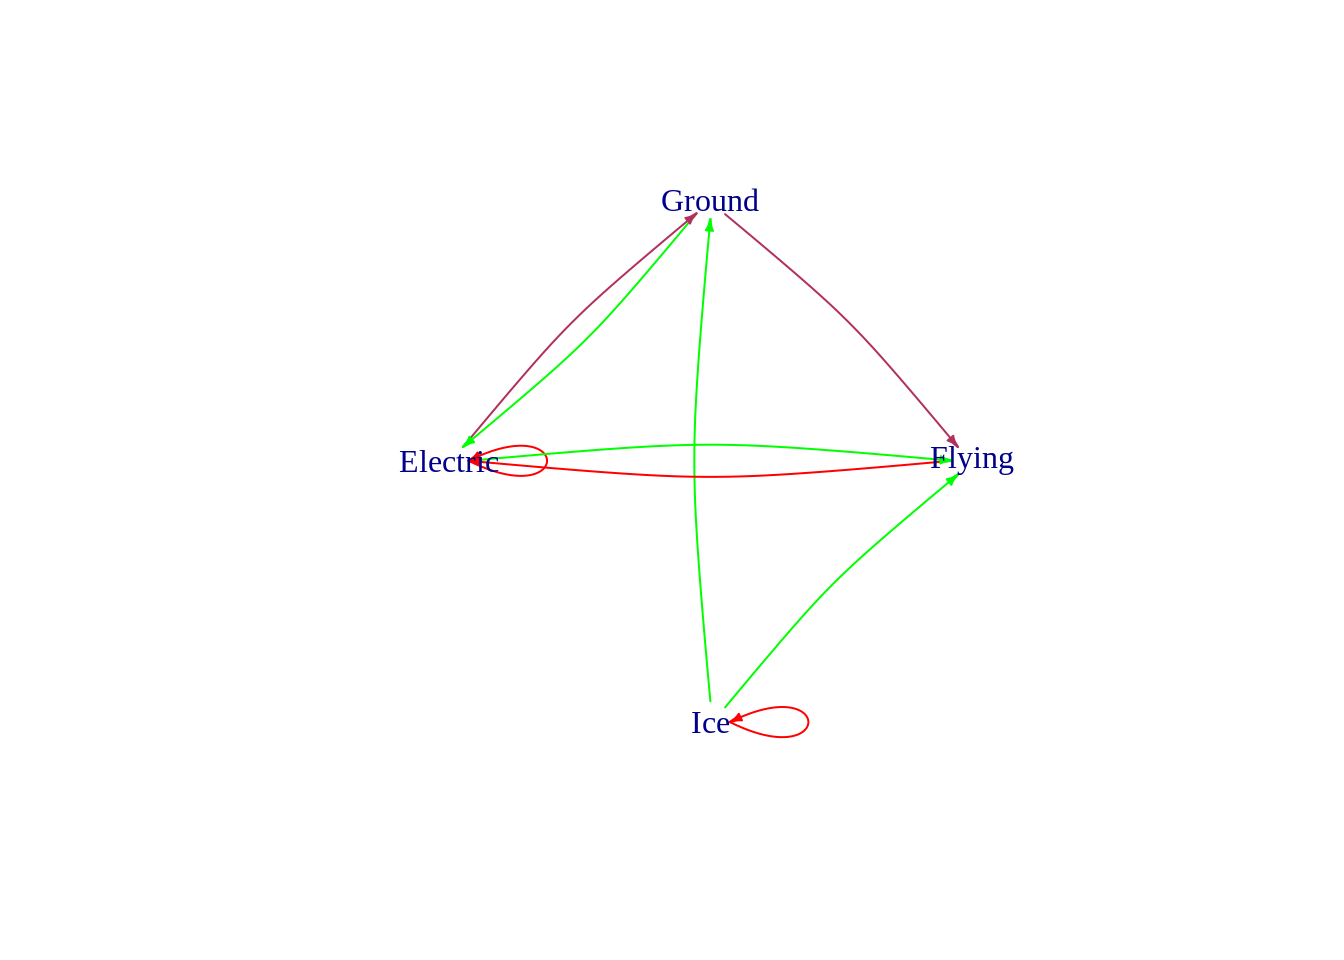
For the kingdom cup
pogo_graph %>%
  activate(nodes) %>%
  filter(name %in% c("Fire", "Ice", "Dragon", "Steel")) %>%
  plot(layout=layout_in_circle, vertex.shape = "none", edge.arrow.size=0.3, edge.curved=0.1)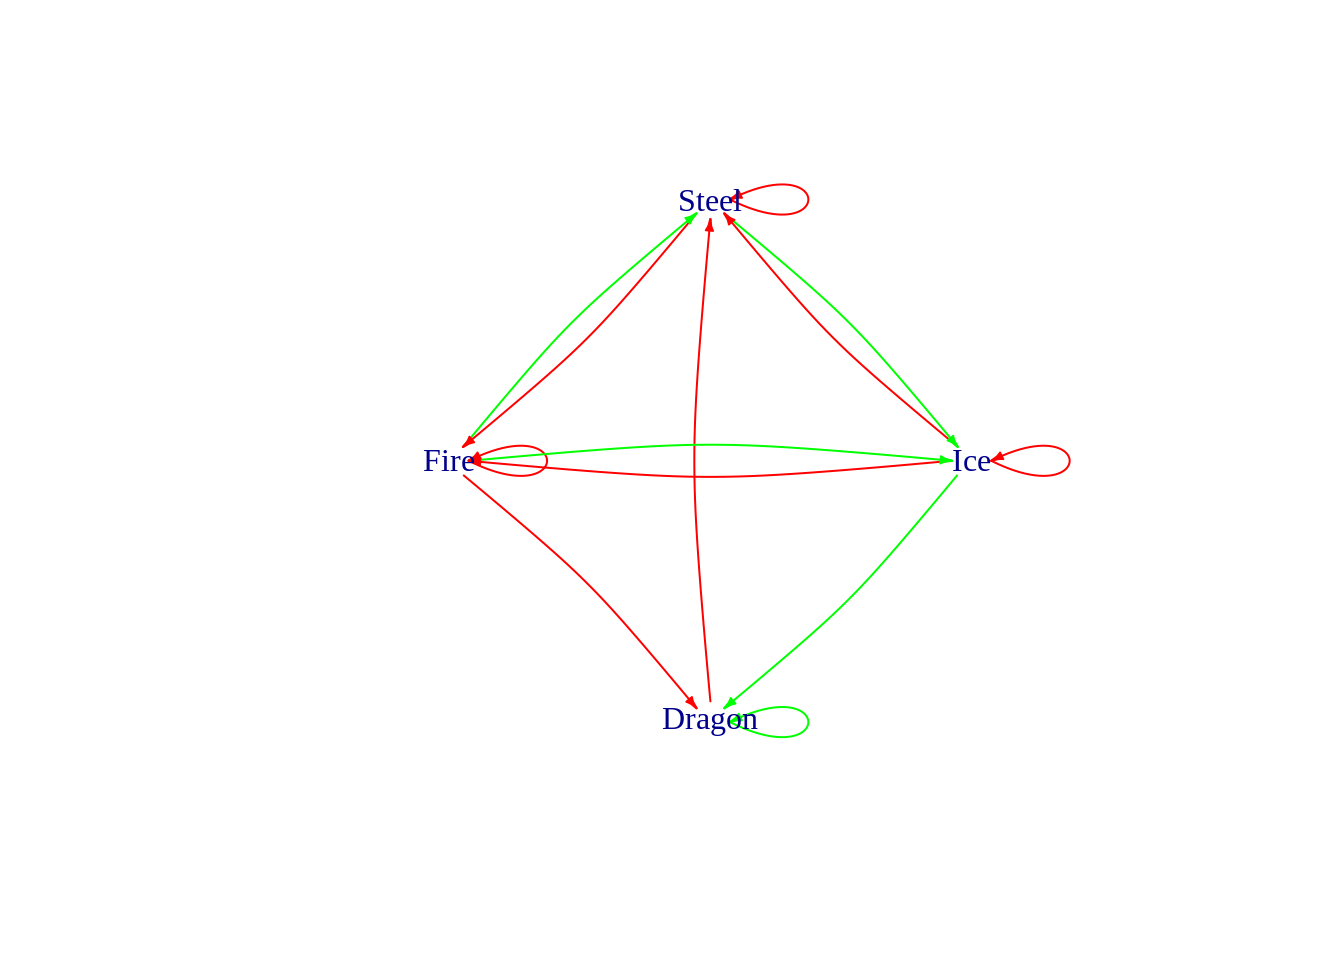
These are all static graphs, we’re online and we have JavaScript.
Using visNetwork:
nodes <- tibble(id = unique(pogo_type_effectiveness$from),
                label=id)

edges <- pogo_type_effectiveness %>%
  filter(!is.na(value)) %>%
  mutate(color = case_when(
    value<0.6 ~ "maroon",
    value < 1 ~ "red",
    TRUE ~ "green"
  )) %>%
  mutate(arrows="to") %>%
  select(-value)

visNetwork(nodes, edges) %>%
  visInteraction(navigationButtons = TRUE)
You can move this one around!
Or in networkD3:
No. I didn’t get networkD3 working.
Collatz Conjecture
XKCD references the Collatz Conjecture:
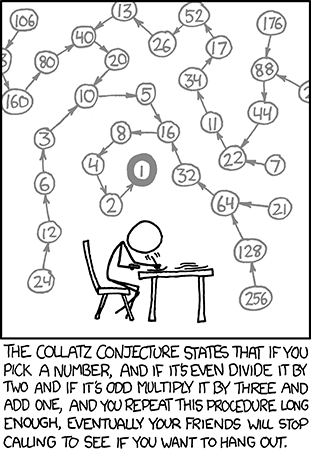
Collatz Conjecture
and it makes me think every time I wear the shirt of it. Both the comic and the shirt have a directed graph, so let’s have a play.
First we need a function that takes an integer 2 or larger to the next number in the sequence. 1 can be the end of the sequence so I don’t get (directed) loops.
collatz <- function(n){
  stopifnot(n == round(n, 0), n>1) #Type forcing means our integers might have become floats.

  case_when(
    n %% 2 == 0 ~ n/2,
    TRUE ~ 3*n+1
  )
}
At this point I’ve discovered ggraph, so I’m doing different graphs to earlier.
set_graph_style(plot_margin = margin(1,1,1,1))

collatz_graph <- tibble(from=2:250, to=collatz(from)) %>%
  as_tbl_graph()

components <- components(collatz_graph) #Try to keep only the ones who have already mapped to 1
component_1 <- names(components$membership[components$membership==1] ) %>%
  as.numeric()

collatz_graph %>%
  activate(nodes) %>%
  filter(name %in% component_1) %>%
  ggraph() + geom_edge_link(arrow = arrow(length = unit(1, 'mm')),
                  start_cap = circle(1, 'mm'),
                  end_cap = circle(1, 'mm')) + geom_node_text(aes(label=name))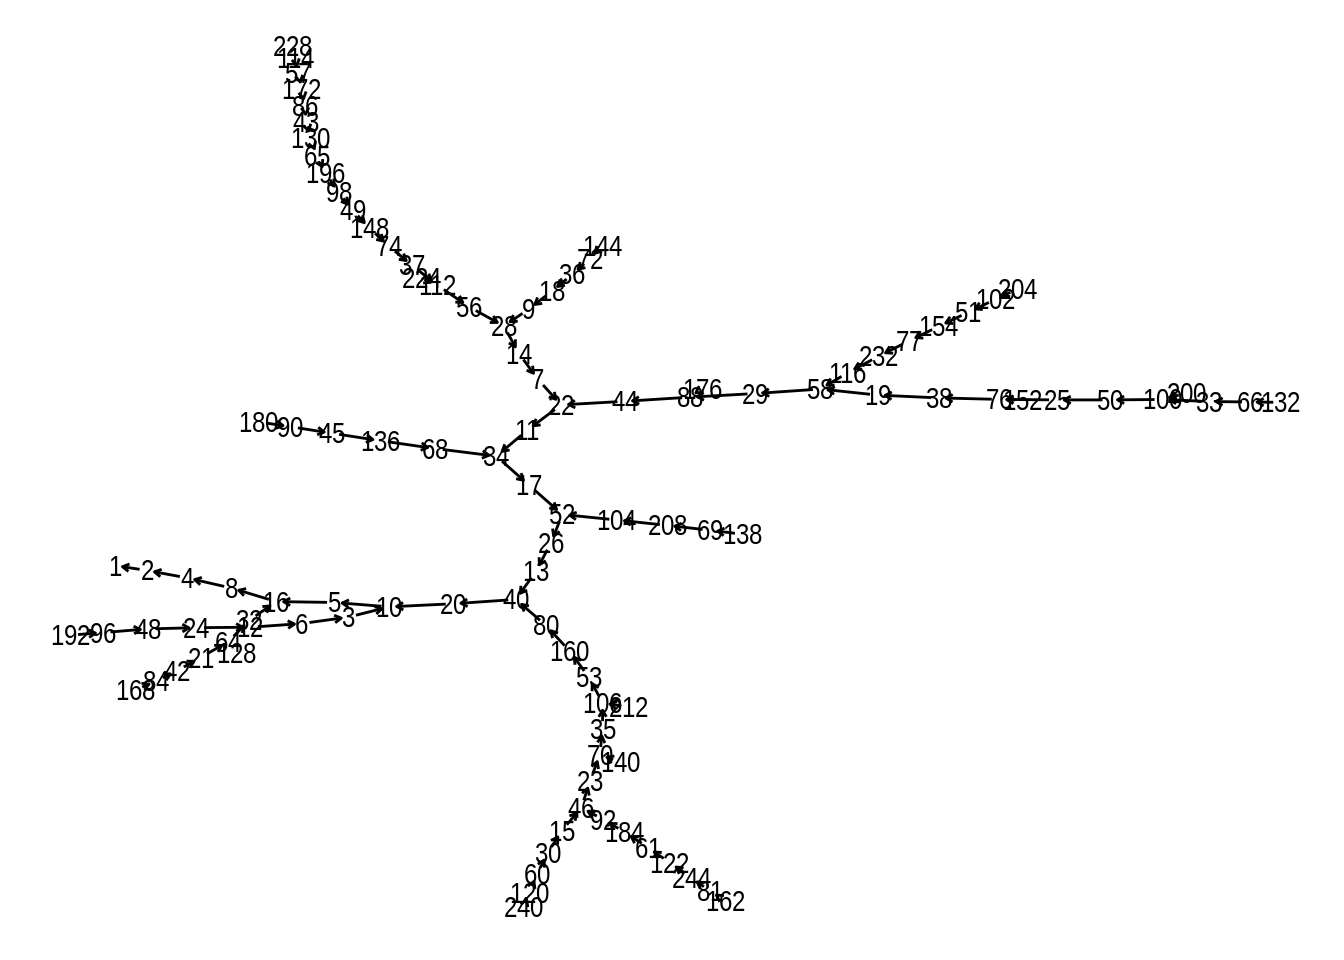
This scales, but not well:
plot_collatz <- function(upper_bound){
  collatz_graph <- tibble(from=2:upper_bound, to=collatz(from)) %>%
    as_tbl_graph()

  components <- components(collatz_graph) #Try to keep only the ones who have already mapped to 1
  component_1 <- names(components$membership[components$membership==1] ) %>%
    as.numeric()

  collatz_graph %>%
    activate(nodes) %>%
    filter(name %in% component_1) %>%
    ggraph() + geom_edge_link(arrow = arrow(length = unit(1, 'mm')),
                    start_cap = circle(1, 'mm'),
                    end_cap = circle(1, 'mm')) + geom_node_text(aes(label=name))
}

plot_collatz(1000)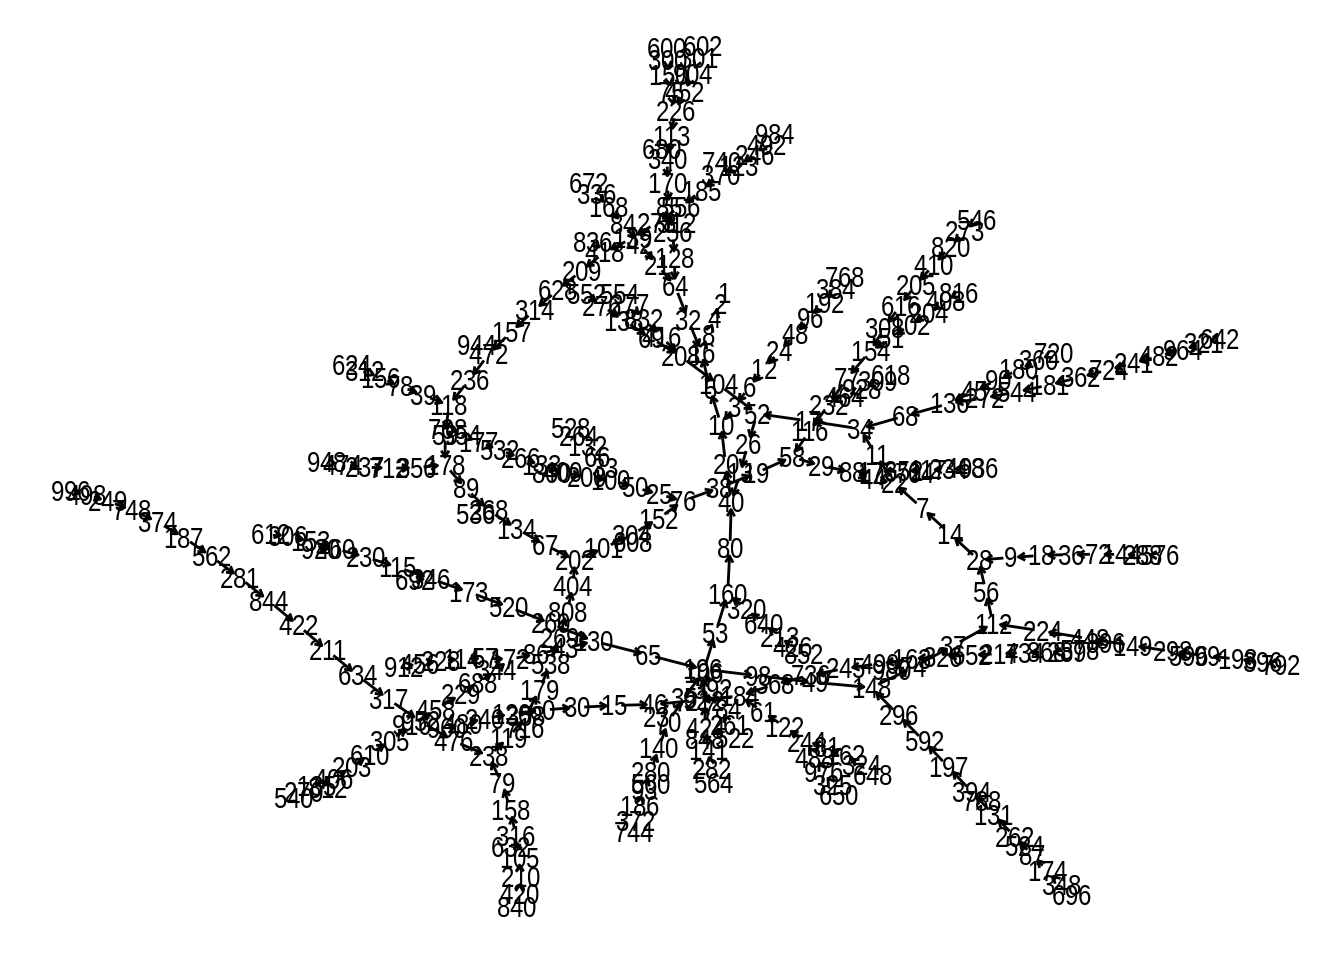
plot_collatz(1e5)