If I had to condense advice for life/wellbeing/career into a soundbite, I’d go with “be curious”.
I’ve been comparing cycle routes on CycleStreets, Google Maps, and Strava. CycleStreets has a energy cost estimate of the journey, with a little ? link next to it.
They outline their estimate of calorie cost of a journey, including their formula.
This is a brilliant example of the mess of units we use. The formula was written for meters/second, I think of road speed in miles per hour, a lot of the world thinks of kilometres per hour. I think of human energy in kcal, the formula wants to use watts.
All my route finders give a total ascent/descent stat, but if I want my distances in miles they give it in feet, when I think of ascent in meters.
Subscribe to R-bloggers already
I have R-bloggers in my News Reader. A while ago the authors of the package announced units on R-bloggers.
I had my formula in science units, my head in a mess of units, but I remembered that I spotted units had been released.
Back to energy spent cycling
A first stab at making that formula as a function:
power = function(v,
                 g=9.81,
                 m=90,
                 k_1=0.0053,
                 k_2=0.26,
                 s=0){
  g * m * v * (k_1 + s) + k_2 * v^3
}

power(5.4)
## [1] 66.20924I simplified it a bit by saying v_a = v_g. And we’ve replicated their example.
If I do the sums, then apply units I can look at a speed-power curve:
tibble(speed = seq(0, 11, length.out= 100)) %>%
  mutate(power = power(speed)) %>%
  mutate(speed = set_units(speed, "m/s")) %>%
  mutate(power = set_units(power, "watts")) %>%
  mutate(speed = set_units(speed, "miles/hour")) %>% #SI to thinking in road speed
  mutate(power = set_units(power, "kcal/hour")) %>% #SI to human-level energy units
  ggplot(aes(x=speed, y=power)) + geom_line()
This is after I tried starting with speed in miles/h and converting to m/s. It didn’t like that because the units are incompatible.
This is great! Sensible errors are better than producing nonsensical output, so let’s rewrite the function including a statement that most of these parameters have dimension.
power = function(v,
                 g=9.81,
                 m=90,
                 k_1=0.0053,
                 k_2=0.26,
                 s=0){
  units(v) <- "m/s"
  units(g) <- "m/s^2"
  units(m) <- "kg"
  units(k_1) <- 1
  units(k_2) <- "kg/m"
  units(s) <- 1
  set_units(g * m * v * (k_1 + s) + k_2 * v^3, "watts")
}
Then what I wanted for the above example is:
tibble(speed = seq(0, 25, length.out = 100)) %>% #I think this is clearer as 2 lines
  mutate(speed = set_units(speed, "miles/hour")) %>%
  mutate(power = power(speed)) %>%
  mutate(power = set_units(power, "kcal/hour")) %>%
  ggplot(aes(x=speed, y=power)) + geom_line()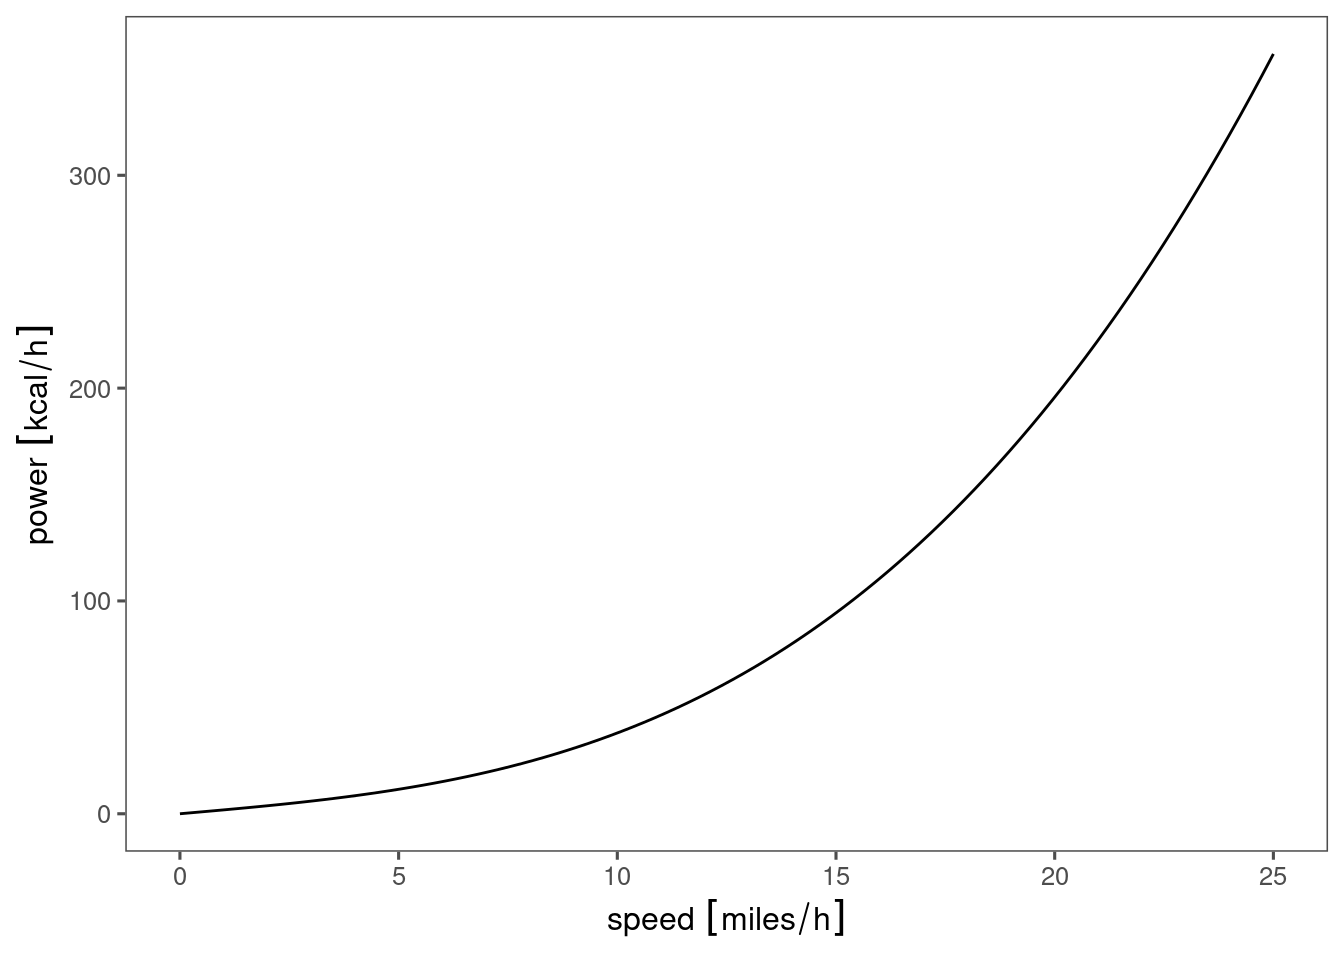
Other graphs
I read Sustainable Energy Without the Hot Air, which suggested in general that moving slower is more energy efficient for distance. 1
I scribbled on my notepad:
I have:
- speed
- power
I want:
- energy per distance
So the dimensional analysis helped me work out what sums I wanted to do.
tibble(speed = seq(0, 25, length.out = 1000)) %>% #I think this is clearer as 2 lines
  mutate(speed = set_units(speed, "miles/hour")) %>%
  mutate(power = power(speed)) %>%
  mutate(energy_per_dist = power/speed) %>%
  mutate(energy_per_dist = set_units(energy_per_dist, "kcal/mile")) %>%
  ggplot(aes(x=speed, y=energy_per_dist)) + geom_line() +
  ggforce::scale_y_unit(breaks = c(0,5,10,15)) + expand_limits(y=c(0,15))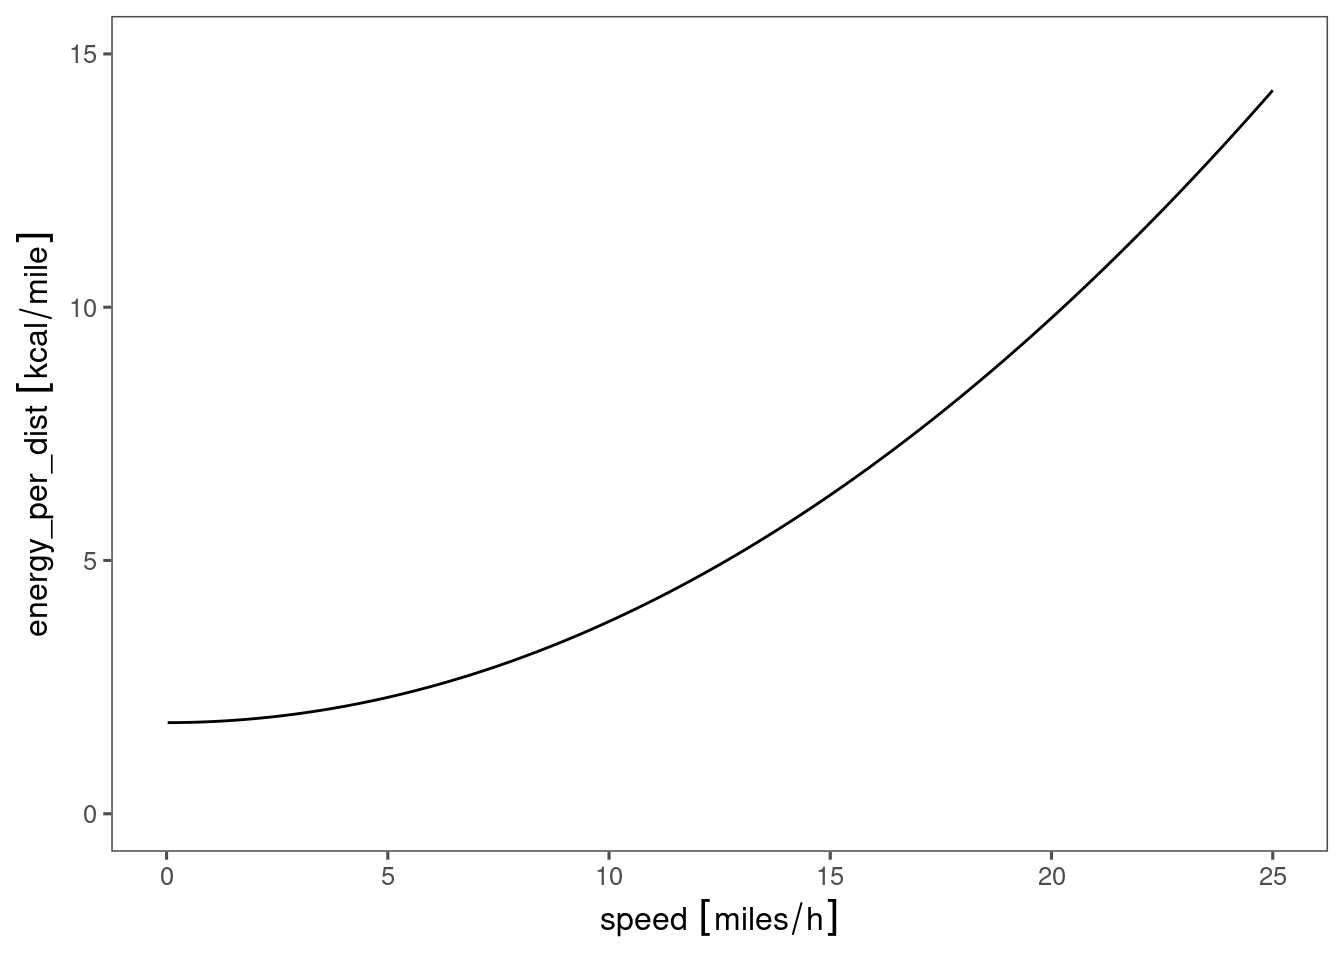
Or using “fat is 9kcal/gram”:
tibble(speed = seq(0, 20, length.out = 1000)) %>%
  mutate(speed = set_units(speed, "miles/hour")) %>%
  mutate(power = power(speed)) %>%
  mutate(energy_per_dist = power/speed) %>%
  mutate(energy_per_dist = set_units(energy_per_dist, "kcal/mile")) %>%
  mutate(fat_burned = energy_per_dist / as_units(9, "kcal/g")) %>%
  mutate(fat_burned = set_units(fat_burned, "g/Mm")) %>%
  ggplot(aes(x=speed, y=fat_burned)) + geom_line() +
  expand_limits(y=0)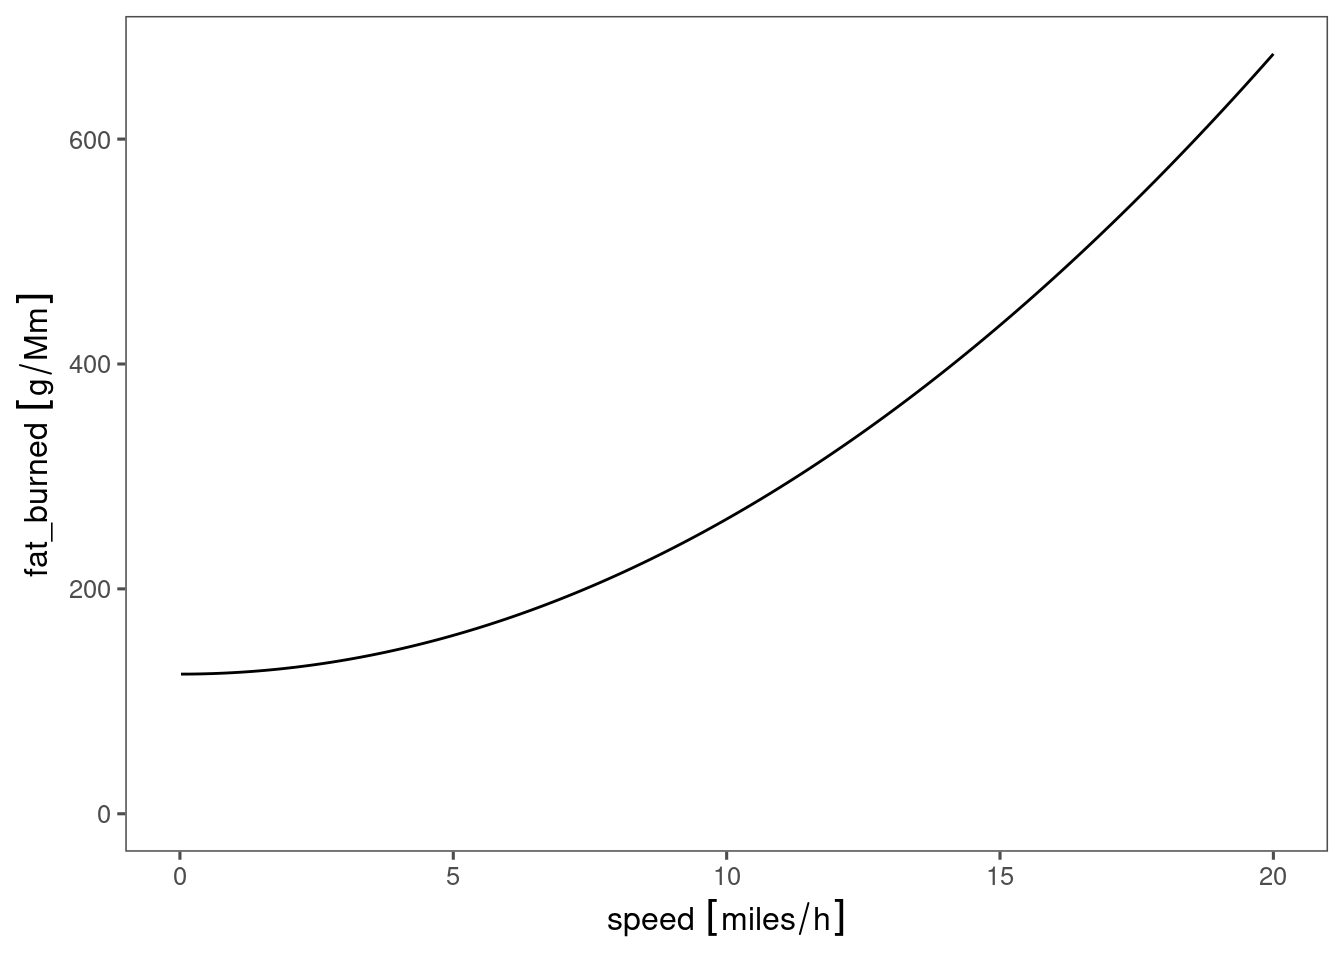
“Mm” being “mega-meters”, or 1000 km. Somewhere in the region of 40 office commutes = 1Mm, for me. I suppose this reinforces the truism that one does cardio to improve their cardiovascular health, not for the energy deficit!
Conclusion
- The {units} package can simplify a bunch of analysis, directly by handling conversion, and indirectly by pointing out that you’re trying to add meters and seconds.
- Cycling can be part of my weight loss, but not the whole story.
That formula sure looks like it’d apply to a motor vehicle, with some different k_1 and k_2.↩︎