Discovering new packages
My news reader is subscribed to the R-bloggers news-feed, which includes RStudio’s ‘Top 40’ new CRAN packages of the month. Most of them go over my head - “Genomics” is its own category, and I know next to nothing about Genomics at that level.
I do know a couple of things about Hilbert Curves, so gghilbertstrings caught my eye.
I’ve started a few longer posts and parked them since the last post. Sometimes it’s good to just go “this 1 graph is pretty”.
What is this fractal?
XKCD already used it for a visualisation, and explain XCKD has a decent explanation of IP addresses, but relies on Wikipedia for explaining the space-filling curve.
Pictures
gganimate is not playing nicely with my Hilbert curves - you can see an animation on the Wiki page above.
I’m going to choose (too many) digits of : I’ve used it for visualising before.
Why you don’t graph in a line:
#Turn Pi into a giant number array.

pi = read_file(here::here("static/data/pi")) %>%
  str_remove_all(" ") %>% # Copied from internet, it had some spaces.
  str_remove_all("\\.") %>%
  str_split("")

pi = pi[[1]] %>%
  as.numeric()


tibble(x = seq_along(pi), pi = pi) %>%
  ggplot(aes(x=x, y=pi)) + geom_point()
All digits get smushed into each other. If I expand:
tibble(x = seq_along(pi), pi = pi) %>%
  filter(x <= 1000) %>%
  ggplot(aes(x=x, y=pi)) + geom_point()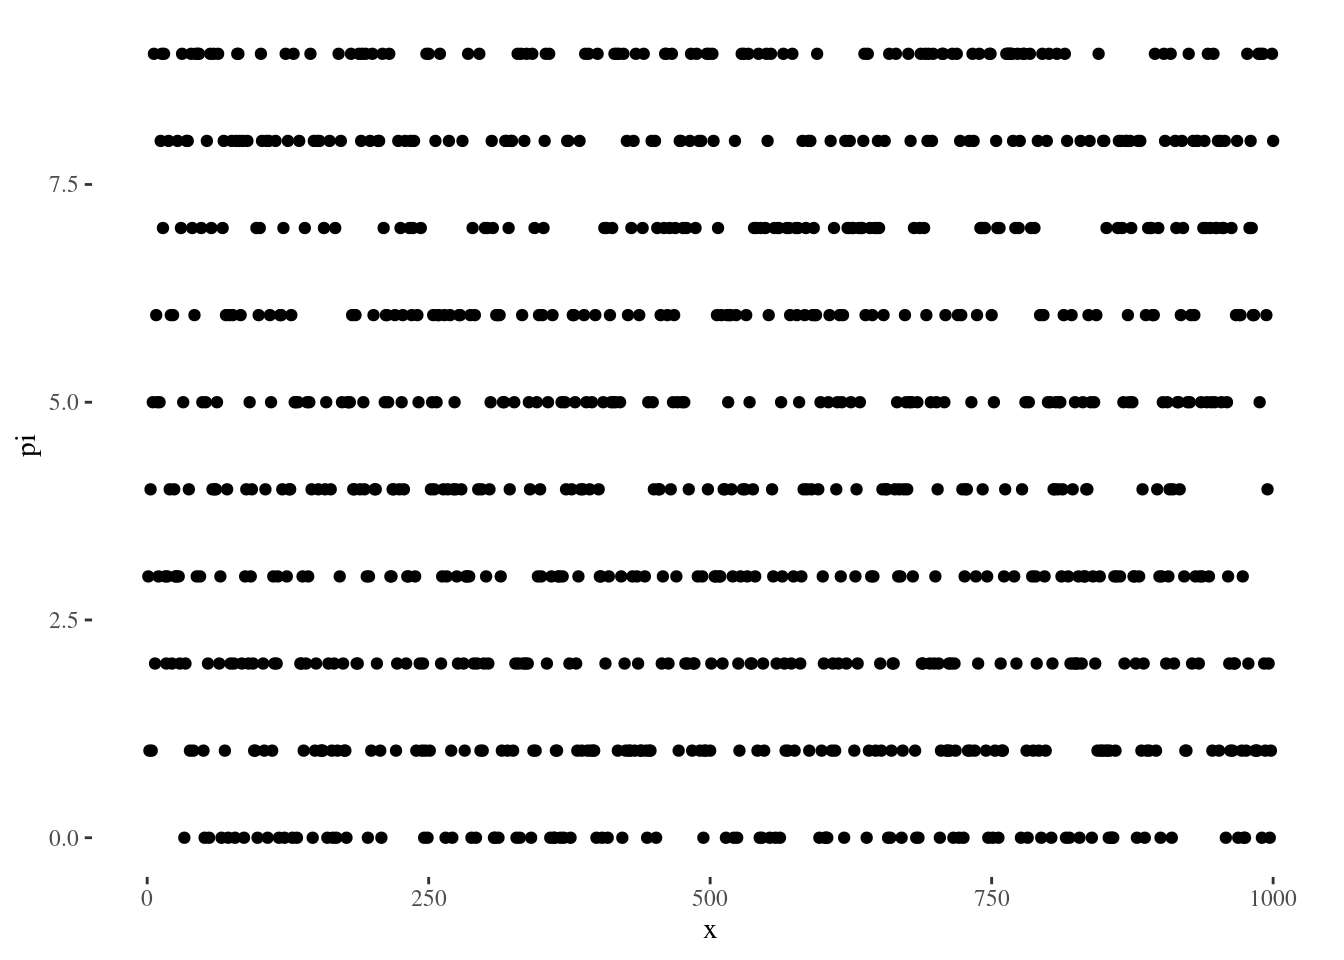
Still blooming useless. But it looks cool. I think there’s a sweet spot where it will look like morse code.
Hilbert Plots
tibble(val = seq_along(pi), pi = pi) %>%
  filter(val <= 1000) %>%
  mutate(pi = as_factor(pi)) %>%
  gghilbertplot(val, color = pi, add_curve = TRUE) + scale_color_viridis_d()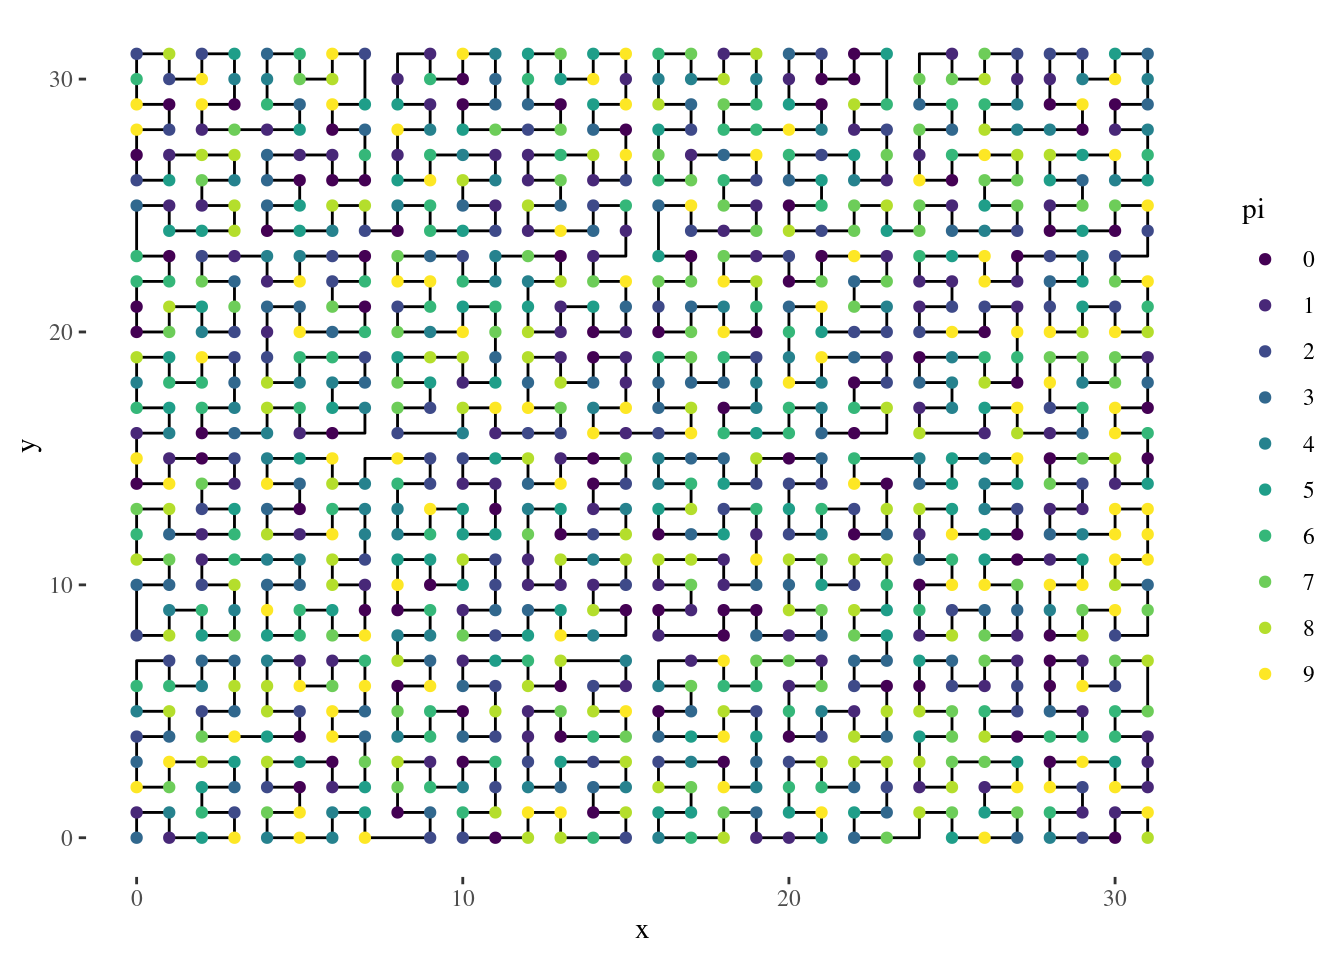
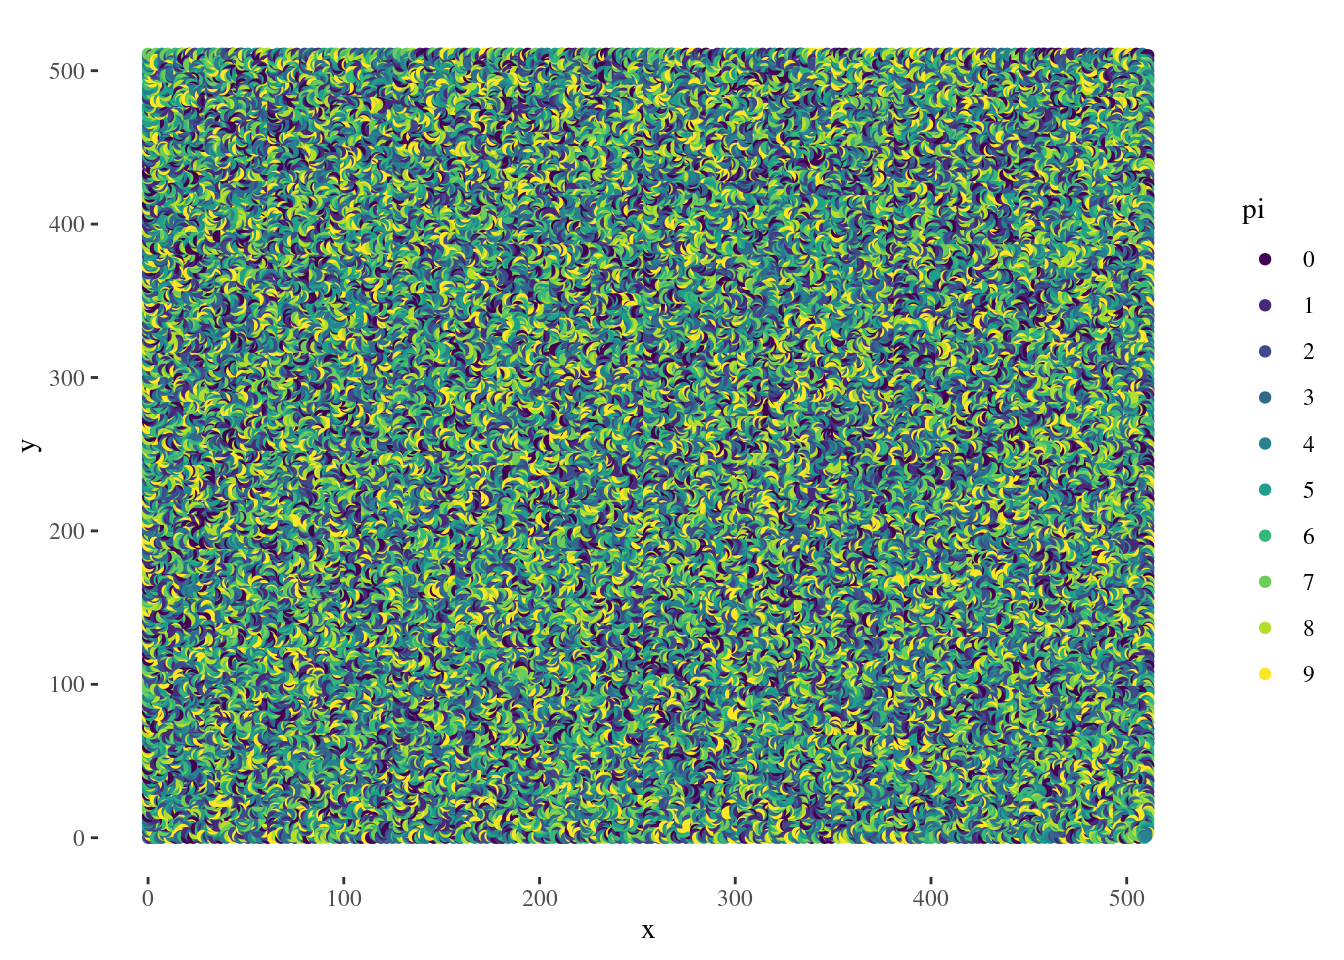
By using more of the plot, we can see more.
At 100k points, there’s serious overplotting and we’re into Jackson Pollock territory.
tibble(val = seq_along(pi), pi = pi) %>%

  mutate(pi = as_factor(pi)) %>%
  gghilbertplot(val, color = pi, add_curve = TRUE) + scale_color_viridis_d()